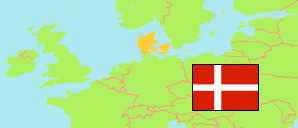
Billund
Municipality in Syddanmark
Municipality
The population development of Billund.
| Name | Status | Population Estimate 2006-01-01 | Population Estimate 2011-01-01 | Population Estimate 2016-01-01 | Population Estimate 2021-01-01 | Population Estimate 2024-01-01 | |
|---|---|---|---|---|---|---|---|
| Billund | Municipality | 26,133 | 26,155 | 26,434 | 26,551 | 27,119 | → |
| Syddanmark [South Denmark] | Region | 1,185,851 | 1,200,656 | 1,211,770 | 1,223,634 | 1,238,406 |
Contents: Urban Settlements
The population development of the urban settlements in Billund.
| Name | Status | Municipality | Population Estimate 2006-01-01 | Population Estimate 2011-01-01 | Population Estimate 2016-01-01 | Population Estimate 2021-01-01 | Population Estimate 2024-01-01 | |
|---|---|---|---|---|---|---|---|---|
| Billund | Urban Settlement | Billund | 6,020 | 6,139 | 6,277 | 6,643 | 7,307 | → |
| Filskov | Urban Settlement | Billund | 627 | 614 | 678 | 658 | 706 | → |
| Grindsted | Urban Settlement | Billund | 9,496 | 9,548 | 9,732 | 9,761 | 9,745 | → |
| Hejnsvig | Urban Settlement | Billund | 1,084 | 1,031 | 1,083 | 1,019 | 1,003 | → |
| Sønder Omme | Urban Settlement | Billund | 1,715 | 1,747 | 1,701 | 1,684 | 1,710 | → |
| Stenderup | Urban Settlement | Billund | 663 | 634 | 647 | 651 | 642 | → |
| Vorbasse | Urban Settlement | Billund | 1,184 | 1,250 | 1,342 | 1,325 | 1,261 | → |
Source: Denmark Statistik.
