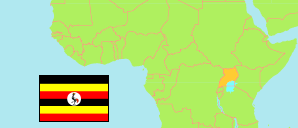
Maracha
District in Uganda
Contents: Population
The population development of Maracha as well as related information and services (Wikipedia, Google, images).
| Name | Status | Population Census 2014-08-27 | Population Census 2024-05-10 | |
|---|---|---|---|---|
| Maracha | District | 186,134 | 234,712 | |
| Uganda | Republic | 34,634,650 | 45,905,417 |
Source: Uganda Bureau of Statistics.
Further information about the population structure:
| Gender (C 2024) | |
|---|---|
| Males | 109,515 |
| Females | 125,197 |
| Age Groups (C 2024) | |
|---|---|
| 0-17 years | 118,827 |
| 18-59 years | 100,977 |
| 60+ years | 14,908 |
