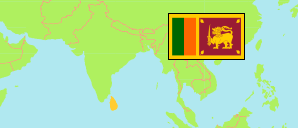
Uva
Province in Sri Lanka
Contents: Subdivision
The population development in Uva as well as related information and services (Wikipedia, Google, images).
| Name | Status | Population Census 1981-03-17 | Population Census 2001-07-17 | Population Census 2012-03-20 | Population Estimate 2021-07-01 | |
|---|---|---|---|---|---|---|
| Uva | Province | 914,522 | 1,177,358 | 1,266,463 | 1,400,000 | |
| Badulla | District | 640,952 | 779,983 | 815,405 | 895,000 | → |
| Moneragala | District | 273,570 | 397,375 | 451,058 | 505,000 | → |
| Sri Lanka | Republic | 14,846,750 | 18,797,257 | 20,359,439 | 22,156,000 |
Source: Department of Census and Statistics, Sri Lanka (web).
Explanation: The 2021 estimates are provisional.
Further information about the population structure:
| Gender (E 2021) | |
|---|---|
| Males | 681,000 |
| Females | 719,000 |
| Urbanization (C 2012) | |
|---|---|
| Rural | 1,034,417 |
| Urban | 69,800 |
| Estate | 162,246 |
| Age Groups (C 2012) | |
|---|---|
| 0-14 years | 339,606 |
| 15-64 years | 840,251 |
| 65+ years | 86,606 |
| Age Distribution (C 2012) | |
|---|---|
| 0-9 years | 232,061 |
| 10-19 years | 212,307 |
| 20-29 years | 188,897 |
| 30-39 years | 185,243 |
| 40-49 years | 168,706 |
| 50-59 years | 142,154 |
| 60-69 years | 85,592 |
| 70-79 years | 38,296 |
| 80+ years | 13,207 |
| Ethnic Group (C 2012) | |
|---|---|
| Sinhalese | 1,023,476 |
| Tamil | 185,571 |
| Sri Lankan Moor | 54,224 |
| Other ethnic group | 3,192 |
| Religion (C 2012) | |
|---|---|
| Buddhist | 1,018,561 |
| Hindu | 169,605 |
| Muslim | 57,001 |
| Christian | 21,095 |
| Other religion | 201 |
| Place of Birth (C 2012) | |
|---|---|
| in the same district | 1,082,487 |
| elsewhere | 183,976 |
