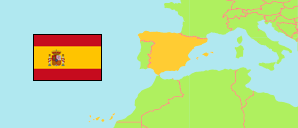
San Felices de los Gallegos
in Salamanca (Castilla y León)
Contents: Municipality
The population development of San Felices de los Gallegos as well as related information and services (weather, Wikipedia, Google, images).
| Name | Province | Population Census 1981-03-01 | Population Census 1991-03-01 | Population Census 2001-11-01 | Population Census 2011-11-01 | Population Census 2021-01-01 | Population Evaluation 2024-01-01 | ||||||||||||
|---|---|---|---|---|---|---|---|---|---|---|---|---|---|---|---|---|---|---|---|
| San Felices de los Gallegos | Salamanca | 846 | 733 | 611 | 490 | 367 | 350 | → | |||||||||||
San Felices de los Gallegos 350 Population [2024] – Evaluation 81.43 km² Area 4.298/km² Population Density [2024] -1.6% Annual Population Change [2021 → 2024] | |||||||||||||||||||
Source: Instituto Nacional de Estadística, Madrid.
Explanation: The latest population figures are based on an evaluation of registers.
Further information about the population structure:
| Gender (R 2024) | |
|---|---|
| Males | 189 |
| Females | 161 |
| Age Groups (R 2024) | |
|---|---|
| 0-17 years | 18 |
| 18-64 years | 154 |
| 65+ years | 178 |
| Age Distribution (R 2024) | |
|---|---|
| 90+ years | 18 |
| 80-89 years | 44 |
| 70-79 years | 81 |
| 60-69 years | 54 |
| 50-59 years | 49 |
| 40-49 years | 34 |
| 30-39 years | 29 |
| 20-29 years | 23 |
| 10-19 years | 8 |
| 0-9 years | 10 |
| Citizenship (R 2024) | |
|---|---|
| Spain | 346 |
| EU | 1 |
| Africa | 2 |
| America | 1 |
| Country of Birth (R 2024) | |
|---|---|
| Spain | 336 |
| EU | 5 |
| Europe (Rest) | 1 |
| Africa | 2 |
| America | 6 |
