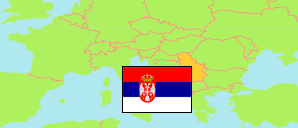
Srem
District in Serbia
Contents: Subdivision
The population development in Srem as well as related information and services (Wikipedia, Google, images).
| Name | Status | Native | Population Census 1991-03-31 | Population Census 2002-04-01 | Population Census 2011-09-30 | Population Census 2022-09-30 | |
|---|---|---|---|---|---|---|---|
| Srem | District | Сремска област | 303,216 | 335,901 | 312,278 | 282,547 | |
| Inđija | Municipality | Инђија | 42,849 | 49,609 | 47,433 | 43,443 | → |
| Irig | Municipality | Ириг | 11,553 | 12,329 | 10,866 | 9,290 | → |
| Pećinci | Municipality | Пећинци | 19,865 | 21,506 | 19,720 | 18,401 | → |
| Ruma | Municipality | Рума | 53,856 | 60,006 | 54,339 | 48,621 | → |
| Šid | Municipality | Шид | 35,578 | 38,973 | 34,188 | 27,894 | → |
| Sremska Mitrovica | City | Сремска Митровица | 83,644 | 85,902 | 79,940 | 72,580 | → |
| Stara Pazova | Municipality | Стара Пазова | 55,871 | 67,576 | 65,792 | 62,318 | → |
| Srbija [Serbia] | Republik | Србија | 7,576,837 | 7,498,001 | 7,186,862 | 6,647,003 |
Source: Statistical Office of the Republic of Serbia (web).
Explanation: The 2011 census was affected by the boycott of the Albanians in the municipalities Preševo and Bujanovac (both located in the District of Pčinja) and partly affected in Medveđa (District of Jablanica).
Further information about the population structure:
| Gender (C 2022) | |
|---|---|
| Males | 139,545 |
| Females | 143,002 |
| Age Groups (C 2022) | |
|---|---|
| 0-17 years | 48,798 |
| 18-64 years | 171,058 |
| 65+ years | 62,691 |
| Age Distribution (C 2022) | |
|---|---|
| 80+ years | 11,830 |
| 70-79 years | 28,170 |
| 60-69 years | 44,931 |
| 50-59 years | 39,839 |
| 40-49 years | 39,534 |
| 30-39 years | 35,282 |
| 20-29 years | 28,675 |
| 10-19 years | 27,384 |
| 0-9 years | 26,902 |
| Urbanization (C 2022) | |
|---|---|
| Rural | 155,165 |
| Urban | 127,382 |
| Ethnic Group (C 2022) | |
|---|---|
| Serbs | 238,200 |
| Hungarians | 2,956 |
| Bosniaks | 73 |
| Roma | 5,493 |
| Albanians | 145 |
| Slovaks | 6,179 |
| Croats | 5,741 |
| Other group | 6,305 |
