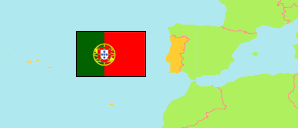
Costa da Caparica
Parish in Setúbal District
Contents: Population
The population development of Costa da Caparica as well as related information and services (Wikipedia, Google, images).
| Name | Status | Population Census 2001-03-12 | Population Census 2011-03-21 | Population Census 2021-03-22 | |
|---|---|---|---|---|---|
| Costa da Caparica | Parish | 11,708 | 13,418 | 13,968 | |
| Setúbal | District | 788,459 | 851,258 | 874,806 |
Source: Instituto Nacional de Estatística Portugal (web).
Further information about the population structure:
| Gender (C 2021) | |
|---|---|
| Males | 6,640 |
| Females | 7,328 |
| Age Groups (C 2021) | |
|---|---|
| 0-14 years | 1,731 |
| 15-64 years | 8,755 |
| 65+ years | 3,482 |
| Age Distribution (C 2021) | |
|---|---|
| 80+ years | 920 |
| 70-79 years | 1,618 |
| 60-69 years | 1,941 |
| 50-59 years | 1,902 |
| 40-49 years | 2,099 |
| 30-39 years | 1,840 |
| 20-29 years | 1,353 |
| 10-19 years | 1,148 |
| 0-9 years | 1,147 |
| Citizenship (C 2021) | |
|---|---|
| Portugal | 12,398 |
| EU | 233 |
| Europe (other) | 99 |
| Africa | 107 |
| America | 945 |
| Asia & Oceania | 186 |
| Country of Birth (C 2021) | |
|---|---|
| Portugal | 11,416 |
| EU | 293 |
| Europe (other) | 165 |
| Africa | 634 |
| America | 1,247 |
| Asia & Oceania | 213 |
