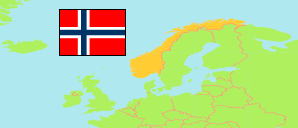
Telemark
County in Norway
Contents: Subdivision
The population development in Telemark as well as related information and services (Wikipedia, Google, images).
| Name | Status | Population Estimate 1986-01-01 | Population Estimate 1993-01-01 | Population Estimate 2000-01-01 | Population Estimate 2006-01-01 | Population Estimate 2013-01-01 | Population Estimate 2020-01-01 | Population Estimate 2025-01-01 | |
|---|---|---|---|---|---|---|---|---|---|
| Telemark | County | 162,529 | 163,350 | 165,038 | 166,140 | 170,902 | 173,355 | 177,863 | |
| Bamble | Municipality | 13,331 | 14,040 | 14,142 | 14,104 | 14,129 | 14,061 | 14,310 | → |
| Drangedal | Municipality | 4,521 | 4,371 | 4,175 | 4,163 | 4,139 | 4,060 | 4,067 | → |
| Fyresdal | Municipality | 1,454 | 1,366 | 1,353 | 1,369 | 1,350 | 1,287 | 1,256 | → |
| Hjartdal | Municipality | 1,724 | 1,694 | 1,687 | 1,619 | 1,609 | 1,573 | 1,646 | → |
| Kragerø | Municipality | 10,855 | 11,011 | 10,656 | 10,477 | 10,700 | 10,380 | 10,446 | → |
| Kviteseid | Municipality | 2,956 | 2,833 | 2,667 | 2,575 | 2,507 | 2,403 | 2,473 | → |
| Midt-Telemark | Municipality | 8,845 | 9,139 | 9,375 | 9,598 | 10,160 | 10,444 | 11,135 | → |
| Nissedal | Municipality | 1,532 | 1,511 | 1,447 | 1,407 | 1,430 | 1,448 | 1,486 | → |
| Nome | Municipality | 7,104 | 6,667 | 6,648 | 6,571 | 6,625 | 6,515 | 6,558 | → |
| Notodden | Municipality | 12,625 | 12,322 | 12,272 | 12,314 | 12,497 | 13,049 | 13,333 | → |
| Porsgrunn | Municipality | 31,317 | 31,214 | 32,892 | 33,550 | 35,392 | 36,397 | 37,289 | → |
| Seljord | Municipality | 3,176 | 3,100 | 2,928 | 2,912 | 2,945 | 2,888 | 2,981 | → |
| Siljan | Municipality | 2,124 | 2,277 | 2,269 | 2,362 | 2,426 | 2,340 | 2,389 | → |
| Skien | Municipality | 47,020 | 48,384 | 49,592 | 50,761 | 53,015 | 54,942 | 56,866 | → |
| Tinn | Municipality | 7,201 | 6,818 | 6,560 | 6,247 | 5,973 | 5,691 | 5,529 | → |
| Tokke | Municipality | 2,750 | 2,597 | 2,506 | 2,417 | 2,284 | 2,201 | 2,238 | → |
| Vinje | Municipality | 3,994 | 4,006 | 3,869 | 3,694 | 3,721 | 3,676 | 3,861 | → |
| Norge (Noreg) [Norway] | Kingdom | 4,159,187 | 4,299,167 | 4,478,497 | 4,640,219 | 5,051,275 | 5,367,580 | 5,594,340 |
Source: Statistics Norway.
Explanation: Counties according to the reestablishment of former counties by 1 January 2024.
Further information about the population structure:
| Gender (E 2025) | |
|---|---|
| Males | 89,007 |
| Females | 88,856 |
| Age Groups (E 2025) | |
|---|---|
| 0-17 years | 33,479 |
| 18-64 years | 103,997 |
| 65+ years | 40,387 |
| Age Distribution (E 2025) | |
|---|---|
| 90+ years | 1,606 |
| 80-89 years | 8,593 |
| 70-79 years | 18,949 |
| 60-69 years | 22,748 |
| 50-59 years | 25,462 |
| 40-49 years | 21,408 |
| 30-39 years | 22,014 |
| 20-29 years | 19,333 |
| 10-19 years | 20,872 |
| 0-9 years | 16,878 |
| Citizenship (E 2025) | |
|---|---|
| Norway | 161,639 |
| Foreign Citizenship | 16,224 |
| Country of Birth (E 2025) | |
|---|---|
| Norway | 150,479 |
| Europe | 14,346 |
| Africa | 3,409 |
| Asia | 8,123 |
| Other country | 1,506 |