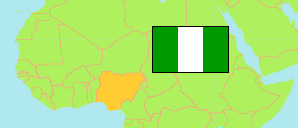
Benue
State in Nigeria
Contents: Subdivision
The population development in Benue as well as related information and services (Wikipedia, Google, images).
| Name | Status | Population Census 1991-11-26 | Population Census 2006-03-21 | Population Projection 2022-03-21 | |
|---|---|---|---|---|---|
| Benue | State | 2,753,077 | 4,253,641 | 6,141,300 | |
| Ado | Local Government Area | 104,137 | 184,389 | 266,200 | → |
| Agatu | Local Government Area | ... | 115,597 | 166,900 | → |
| Apa | Local Government Area | ... | 96,780 | 139,700 | → |
| Buruku | Local Government Area | 130,450 | 206,215 | 297,700 | → |
| Gboko | Local Government Area | ... | 361,325 | 521,700 | → |
| Guma | Local Government Area | 116,336 | 194,164 | 280,300 | → |
| Gwer East | Local Government Area | 117,630 | 168,660 | 243,500 | → |
| Gwer West | Local Government Area | 74,588 | 122,313 | 176,600 | → |
| Katsina-Ala | Local Government Area | ... | 225,471 | 325,500 | → |
| Konshisha | Local Government Area | 145,614 | 226,492 | 327,000 | → |
| Kwande | Local Government Area | 180,327 | 248,642 | 359,000 | → |
| Logo | Local Government Area | ... | 169,570 | 244,800 | → |
| Makurdi | Local Government Area | 239,889 | 300,377 | 433,700 | → |
| Obi | Local Government Area | ... | 98,707 | 142,500 | → |
| Ogbadibo | Local Government Area | 89,497 | 130,988 | 189,100 | → |
| Ohimini | Local Government Area | ... | 70,688 | 102,100 | → |
| Oju | Local Government Area | ... | 168,491 | 243,300 | → |
| Okpokwu | Local Government Area | 90,241 | 175,596 | 253,500 | → |
| Oturkpo | Local Government Area | ... | 266,411 | 384,600 | → |
| Tarka | Local Government Area | ... | 79,280 | 114,500 | → |
| Ukum | Local Government Area | 167,266 | 216,983 | 313,300 | → |
| Ushongo | Local Government Area | 123,166 | 191,935 | 277,100 | → |
| Vandeikya | Local Government Area | 161,863 | 234,567 | 338,700 | → |
| Nigeria | Federal Republic | 88,992,220 | 140,431,790 | 216,783,400 |
Source: National Population Commission of Nigeria (web), National Bureau of Statistics (web).
Explanation: The population projection assumes the same rate of growth for all LGAs within a state. The undercount of the 1991 census is estimated to be about 25 million. All population figures for Nigeria show high error rates; census results are disputed. Area figures are computed using geospatial data.
Further information about the population structure:
| Gender (C 2006) | |
|---|---|
| Males | 2,144,043 |
| Females | 2,109,598 |
| Age Groups (C 2006) | |
|---|---|
| 0-14 years | 1,958,919 |
| 15-64 years | 2,158,292 |
| 65+ years | 136,430 |
| Age Distribution (C 2006) | |
|---|---|
| 0-9 years | 1,445,573 |
| 10-19 years | 970,971 |
| 20-29 years | 720,544 |
| 30-39 years | 453,464 |
| 40-49 years | 292,048 |
| 50-59 years | 163,294 |
| 60-69 years | 101,418 |
| 70-79 years | 56,206 |
| 80+ years | 50,123 |