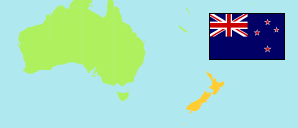
Queen Street South West
Statististical Area in Auckland
Contents: Population
The population development of Queen Street South West as well as related information and services (Wikipedia, Google, images).
| Name | Status | Population Estimate 1996-06-30 | Population Estimate 2001-06-30 | Population Estimate 2006-06-30 | Population Estimate 2013-06-30 | Population Estimate 2018-06-30 | Population Estimate 2022-06-30 | ||||||||||||
|---|---|---|---|---|---|---|---|---|---|---|---|---|---|---|---|---|---|---|---|
| Queen Street South West | Statististical Area | 630 | 760 | 1,280 | 1,570 | 1,770 | 1,840 | ||||||||||||
Queen Street South West 1,840 Population [2022] – Estimate 0.2290 km² Area 8,035/km² Population Density [2022] 0.97% Annual Population Change [2018 → 2022] | |||||||||||||||||||
| Auckland | Main Urban Area | 977,000 | 1,063,500 | 1,195,700 | 1,292,900 | 1,420,600 | 1,440,300 | ||||||||||||
Source: Statistics New Zealand / Te Tari Tatau (web).
Explanation: Population estimates for 2018 and later are based on the results of the 2018 census. The 2022 figures are provisional.
Further information about the population structure:
| Gender (E 2022) | |
|---|---|
| Males | 970 |
| Females | 870 |
| Age Groups (E 2022) | |
|---|---|
| 0-14 years | 110 |
| 15-64 years | 1,580 |
| 65+ years | 160 |
| Age Distribution (E 2022) | |
|---|---|
| 90+ years | 5 |
| 80-89 years | 25 |
| 70-79 years | 75 |
| 60-69 years | 120 |
| 50-59 years | 185 |
| 40-49 years | 210 |
| 30-39 years | 460 |
| 20-29 years | 580 |
| 10-19 years | 100 |
| 0-9 years | 80 |
| Religion (C 2018) | |
|---|---|
| Anglican | 33 |
| Catholic | 183 |
| Presbyterian | 33 |
| Other Christian | 231 |
| Maori Beliefs | 15 |
| Muslim | 54 |
| Buddhist | 48 |
| Hindu | 93 |
| Other religion | 60 |
| No religion | 783 |
| Country of Birth (C 2018) | |
|---|---|
| New Zealand | 423 |
| Oceania | 33 |
| Europe | 228 |
| Asia | 663 |
| Other country | 171 |
| Ethnic Group (C 2018) | |
|---|---|
| European | 636 |
| Maori | 123 |
| Pacific | 54 |
| Asian | 747 |
| Other group | 162 |
