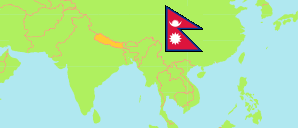
Sarlahi
District in Nepal
Contents: Subdivision
The population development in Sarlahi as well as related information and services (Wikipedia, Google, images).
| Name | Status | Transcription | Native | Population Census 2001-05-28 | Population Census 2011-06-22 | Population Census 2021-11-25 | |
|---|---|---|---|---|---|---|---|
| Sarlahi | District | Sarlāhī | सर्लाही जिल्ला | 635,701 | 769,729 | 862,470 | |
| Bagmati | Municipality | Bāgamatī | बागमती नगरपालिका | ... | 40,399 | 47,106 | → |
| Balra | Municipality | Balarā | बलरा नगरपालिका | ... | 45,194 | 47,912 | → |
| Barhathawa | Municipality | Barahathavā | बरहथवा नगरपालिका | ... | 69,822 | 81,120 | → |
| Basbariya | Rural Municipality | Basabarīyā | बसबरीया गाउँपालिका | 18,872 | 23,568 | 25,905 | → |
| Bishnu | Rural Municipality | Viṣṇu | विष्णु गाउँपालिका | ... | 24,748 | 28,570 | → |
| Brahmapuri | Rural Municipality | Brahmapurī | ब्रह्मपुरी गाउँपालिका | 24,905 | 29,832 | 31,378 | → |
| Chakraghatta | Rural Municipality | Cakraghaṭṭā | चक्रघट्टा गाउँपालिका | 22,951 | 27,952 | 29,550 | → |
| Chandranagar | Rural Municipality | Candranagara | चन्द्रनगर गाउँपालिका | 26,179 | 33,345 | 36,908 | → |
| Dhankaul | Rural Municipality | Dhanakaula | धनकौल गाउँपालिका | ... | 24,788 | 27,974 | → |
| Godaita | Municipality | Gōḍaiṭā | गोडैटा नगरपालिका | 39,130 | 47,687 | 54,270 | → |
| Haripur | Municipality | Haripura | हरिपुर नगरपालिका | ... | 37,445 | 43,233 | → |
| Haripurwa | Municipality | Haripurvā | हरिपुर्वा नगरपालिका | ... | 36,042 | 38,714 | → |
| Hariwan | Municipality | Harivana | हरिवन नगरपालिका | ... | 43,924 | 49,988 | → |
| Ishworpur | Municipality | Īśvarapura | ईश्वरपुर नगरपालिका | 51,243 | 60,000 | 68,377 | → |
| Kaudena | Rural Municipality | Kauḍēnā | कौडेना गाउँपालिका | 21,182 | 26,085 | 28,702 | → |
| Kawilasi | Municipality | Kavilāsī | कविलासी नगरपालिका | 34,495 | 42,336 | 44,204 | → |
| Lalbandi | Municipality | Lālabandī | लालबन्दी नगरपालिका | 51,448 | 59,628 | 66,419 | → |
| Malangwa | Municipality | Malaṅvā | मलङ्वा नगरपालिका | 36,380 | 46,557 | 54,550 | → |
| Parsa | Rural Municipality | Parsā | पर्सा गाउँपालिका | 16,905 | 21,650 | 24,005 | → |
| Ramnagar | Rural Municipality | Rāmanagara | रामनगर गाउँपालिका | ... | 28,727 | 31,366 | → |
| Nepal | Federal Republic | Nēpāla | नेपाल | 23,151,423 | 26,494,504 | 29,164,578 |
Source: Central Bureau of Statistics Nepal (web).
Explanation: The local units became operational in May 2017. The 2021 population of local units exclude institional population.
Further information about the population structure:
| Gender (C 2021) | |
|---|---|
| Males | 435,131 |
| Females | 427,339 |
| Age Groups (C 2021) | |
|---|---|
| 0-14 years | 283,940 |
| 15-64 years | 525,416 |
| 65+ years | 53,114 |
| Age Distribution (C 2021) | |
|---|---|
| 90+ years | 1,139 |
| 80-89 years | 4,734 |
| 70-79 years | 26,811 |
| 60-69 years | 44,885 |
| 50-59 years | 61,846 |
| 40-49 years | 85,049 |
| 30-39 years | 112,741 |
| 20-29 years | 149,979 |
| 10-19 years | 190,385 |
| 0-9 years | 184,901 |
| Citizenhip (C 2021) | |
|---|---|
| Nepal | 860,122 |
| India | 2,327 |
| Other Citizenship | 18 |
| Place of Birth (C 2021) | |
|---|---|
| Same local unit | 662,118 |
| Other local unit in same district | 92,771 |
| Other district | 80,322 |
| Other country | 27,131 |
| Literacy (A5+) (C 2021) | |
|---|---|
| Yes | 467,669 |
| Only reading | 1,477 |
| No | 306,128 |