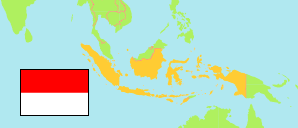
Kota Pematangsiantar
City in North Sumatra Province
Contents: Population
The population development in Kota Pematangsiantar as well as related information and services (Wikipedia, Google, images).
| Name | Status | Population Census 2005-06-30 | Population Census 2010-05-01 | Population Census 2015-05-01 | Population Census 2020-09-15 | ||||||||||||||
|---|---|---|---|---|---|---|---|---|---|---|---|---|---|---|---|---|---|---|---|
| Kota Pematangsiantar | City | 229,525 | 234,698 | 247,219 | 268,254 | ||||||||||||||
Kota Pematangsiantar 268,254 Population [2020] – Census 55.66 km² Area 4,820/km² Population Density [2020] 1.5% Annual Population Change [2015 → 2020] | |||||||||||||||||||
| Sumatera Utara [North Sumatra] | Province | 12,450,911 | 12,982,204 | 13,923,262 | 14,799,361 | ||||||||||||||
Source: Badan Pusat Statistik, Republik Indonesia (web).
Explanation: 2005 and 2015 figures are result of an intermediate census.
Further information about the population structure:
| Gender (C 2020) | |
|---|---|
| Males | 132,615 |
| Females | 135,639 |
| Age Groups (C 2020) | |
|---|---|
| 0-14 years | 66,507 |
| 15-59 years | 182,284 |
| 65+ years | 19,463 |
| Age Distribution (C 2020) | |
|---|---|
| 90+ years | 217 |
| 80-89 years | 2,609 |
| 70-79 years | 8,454 |
| 60-69 years | 19,061 |
| 50-59 years | 29,048 |
| 40-49 years | 34,480 |
| 30-39 years | 39,101 |
| 20-29 years | 44,887 |
| 10-19 years | 45,921 |
| 0-9 years | 44,476 |
