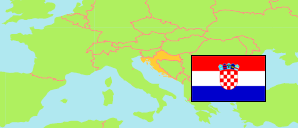
Bobovica
in Samobor (Zagreb )
Contents: Settlement
The population development of Bobovica as well as related information and services (weather, Wikipedia, Google, images).
| Name | Municipality | Population Census 2001-03-31 | Population Census 2011-03-31 | Population Census 2021-08-31 | |||||||||||||||
|---|---|---|---|---|---|---|---|---|---|---|---|---|---|---|---|---|---|---|---|
| Bobovica | Samobor | 279 | 285 | 258 | → | ||||||||||||||
Bobovica 258 Population [2021] – Census 1.914 km² Area 134.8/km² Population Density [2021] -0.95% Annual Population Change [2011 → 2021] | |||||||||||||||||||
Source: Croatian Bureau of Statistics (web).
Explanation: Area figures are computed by using geospatial data.
Further information about the population structure:
| Gender (C 2021) | |
|---|---|
| Males | 120 |
| Females | 138 |
| Age Groups (C 2021) | |
|---|---|
| 0-14 years | 35 |
| 15-64 years | 164 |
| 65+ years | 59 |
| Age Distribution (C 2021) | |
|---|---|
| 90+ years | 2 |
| 80-89 years | 9 |
| 70-79 years | 26 |
| 60-69 years | 37 |
| 50-59 years | 40 |
| 40-49 years | 45 |
| 30-39 years | 21 |
| 20-29 years | 27 |
| 10-19 years | 30 |
| 0-9 years | 21 |
