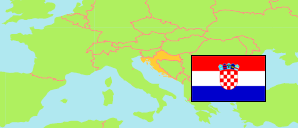
Novigrad
in Novigrad (Zadar )
Contents: Settlement
The population development of Novigrad as well as related information and services (weather, Wikipedia, Google, images).
| Name | Municipality | Population Census 2001-03-31 | Population Census 2011-03-31 | Population Census 2021-08-31 | |
|---|---|---|---|---|---|
| Novigrad | Novigrad | 542 | 534 | 481 | → |
Source: Croatian Bureau of Statistics (web).
Explanation: Area figures are computed by using geospatial data.
Further information about the population structure:
| Gender (C 2021) | |
|---|---|
| Males | 234 |
| Females | 247 |
| Age Groups (C 2021) | |
|---|---|
| 0-14 years | 45 |
| 15-64 years | 272 |
| 65+ years | 164 |
| Age Distribution (C 2021) | |
|---|---|
| 90+ years | 3 |
| 80-89 years | 50 |
| 70-79 years | 74 |
| 60-69 years | 79 |
| 50-59 years | 78 |
| 40-49 years | 34 |
| 30-39 years | 49 |
| 20-29 years | 59 |
| 10-19 years | 20 |
| 0-9 years | 35 |
