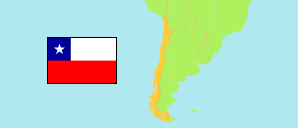
Malleco
Province in Chile
Contents: Subdivision
The population development in Malleco as well as related information and services (Wikipedia, Google, images).
| Name | Status | Population Estimate 2002-07-01 | Population Estimate 2007-07-01 | Population Estimate 2012-07-01 | Population Estimate 2017-07-01 | Population Projection 2023-07-01 | |
|---|---|---|---|---|---|---|---|
| Malleco | Province | 209,178 | 208,501 | 210,676 | 213,316 | 216,169 | |
| Angol | Municipality | 50,623 | 51,909 | 53,594 | 55,140 | 56,644 | → |
| Collipulli | Municipality | 23,337 | 24,066 | 24,908 | 25,681 | 26,468 | → |
| Curacautín | Municipality | 17,635 | 17,680 | 17,868 | 18,054 | 18,210 | → |
| Ercilla | Municipality | 9,461 | 8,895 | 8,628 | 8,495 | 8,405 | → |
| Lonquimay | Municipality | 10,454 | 10,577 | 10,764 | 10,939 | 11,101 | → |
| Los Sauces | Municipality | 8,043 | 7,723 | 7,587 | 7,524 | 7,484 | → |
| Lumaco | Municipality | 11,720 | 10,847 | 10,399 | 10,132 | 9,947 | → |
| Purén | Municipality | 13,469 | 12,742 | 12,401 | 12,223 | 12,118 | → |
| Renaico | Municipality | 9,599 | 9,953 | 10,311 | 10,634 | 10,964 | → |
| Traiguén | Municipality | 19,929 | 19,427 | 19,296 | 19,275 | 19,287 | → |
| Victoria | Municipality | 34,908 | 34,682 | 34,920 | 35,219 | 35,541 | → |
| Chile | Republic | 15,691,701 | 16,517,933 | 17,443,491 | 18,419,192 | 19,960,889 |
Source: Instituto Nacional de Estadísticas.
Explanation: All tabulated population figures consider the results of the 2017 census.
Further information about the population structure:
| Gender (P 2023) | |
|---|---|
| Males | 105,504 |
| Females | 110,665 |
| Age Groups (P 2023) | |
|---|---|
| 0-17 years | 50,407 |
| 18-64 years | 130,086 |
| 65+ years | 35,676 |
| Age Distribution (P 2023) | |
|---|---|
| 80+ years | 9,020 |
| 70-79 years | 15,310 |
| 60-69 years | 24,467 |
| 50-59 years | 28,968 |
| 40-49 years | 28,225 |
| 30-39 years | 29,507 |
| 20-29 years | 25,599 |
| 10-19 years | 28,273 |
| 0-9 years | 26,800 |
| Urbanization (C 2017) | |
|---|---|
| Rural | 54,067 |
| Urban | 151,057 |
| Country of Birth (C 2017) | |
|---|---|
| Chile | 203,987 |
| South America | 884 |
| Central America & Caribbean | 51 |
| North America | 45 |
| Europe | 90 |
| Other country & undeclared | 67 |
