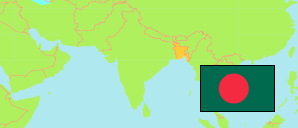
Pirganj
Municipality in Rangpur Division
Contents: Population
The population development of Pirganj as well as related information and services (Wikipedia, Google, images).
| Name | Status | Transcription | Native | Population Census 1991-03-13 | Population Census 2001-01-22 | Population Census 2011-03-15 | Population Census 2022-06-14 | |
|---|---|---|---|---|---|---|---|---|
| Pirganj | Municipality | Pīragañja | পীরগঞ্জ | 17,807 | 23,573 | 27,700 | 31,403 | |
| Rangpur | Division | Raṁpura | রংপুর বিভাগ | 11,997,979 | 13,847,150 | 15,787,758 | 17,610,955 |
Source: Bangladesh Bureau of Statistics.
Explanation: Area figures of union councils, municipalities and city districts are calculated by using geospatial data.
Further information about the population structure:
| Gender (C 2022) | |
|---|---|
| Males | 15,709 |
| Females | 15,691 |
| Hijra | 3 |
| Religion (C 2022) | |
|---|---|
| Muslim | 28,880 |
| Hindu | 2,490 |
| Buddhist | 2 |
| Christian | 28 |
