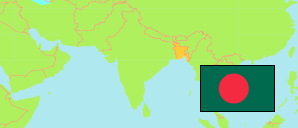
Madaripur
District in Bangladesh
Contents: Subdivision
The population development in Madaripur as well as related information and services (Wikipedia, Google, images).
| Name | Status | Transcription | Native | Population Census 1991-03-13 | Population Census 2001-01-22 | Population Census 2011-03-15 | Population Census 2022-06-14 | |
|---|---|---|---|---|---|---|---|---|
| Madaripur | District | Mādārīpura | মাদারীপুর জেলা | 1,069,176 | 1,146,349 | 1,165,952 | 1,293,027 | |
| Dasar [← Kalkini] | Subdistrict | Ḍāsāra | ডাসার উপজেলা | 67,630 | 71,464 | 71,494 | 75,172 | → |
| Kalkini | Subdistrict | Kālakini | কালকিনি উপজেলা | 183,286 | 200,332 | 201,764 | 218,330 | → |
| Madaripur Sadar | Subdistrict | Mādārīpura Sadara | মাদারীপুর সদর উপজেলা | 307,822 | 332,020 | 345,764 | 396,772 | → |
| Rajoir | Subdistrict | Rājaira | রাজৈর উপজেলা | 204,356 | 218,095 | 228,710 | 245,316 | → |
| Shibchar | Subdistrict | Śibacara | শিবচর উপজেলা | 306,082 | 324,438 | 318,220 | 357,437 | → |
| Bangladesh | People's Republic | Bā̃lādēśa | বাংলাদেশ | 106,314,992 | 124,355,263 | 144,043,697 | 165,158,616 |
Source: Bangladesh Bureau of Statistics.
Explanation: The tabulated figures are not adjusted for underenumeration. Some area figures are derived from geospatial data.
Further information about the population structure:
| Gender (C 2022) | |
|---|---|
| Males | 615,762 |
| Females | 677,201 |
| Hijra | 64 |
| Age Groups (C 2022) | |
|---|---|
| 0-14 years | 391,076 |
| 15-64 years | 806,174 |
| 65+ years | 95,713 |
| Age Distribution (C 2022) | |
|---|---|
| 90+ years | 4,602 |
| 80-89 years | 12,859 |
| 70-79 years | 41,509 |
| 60-69 years | 86,525 |
| 50-59 years | 105,730 |
| 40-49 years | 133,558 |
| 30-39 years | 177,317 |
| 20-29 years | 207,735 |
| 10-19 years | 269,017 |
| 0-9 years | 254,111 |
| Urbanization (C 2022) | |
|---|---|
| Rural | 977,556 |
| Urban | 315,471 |
| Religion (C 2022) | |
|---|---|
| Muslim | 1,146,621 |
| Hindu | 144,897 |
| Buddhist | 92 |
| Christian | 1,344 |
| Other Religion | 9 |
