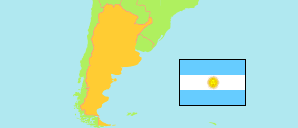
San Javier
Department in Misiones (Argentina)
Contents: Population
The population development of San Javier as well as related information and services (Wikipedia, Google, images).
| Name | Status | Population Census 1991-05-15 | Population Census 2001-11-17 | Population Census 2010-10-27 | Population Census 2022-05-18 | ||||||||||||||
|---|---|---|---|---|---|---|---|---|---|---|---|---|---|---|---|---|---|---|---|
| San Javier | Department | 17,693 | 19,187 | 20,906 | 23,503 | ||||||||||||||
San Javier 23,503 Population [2022] – Census 536.0 km² Area 43.85/km² Population Density [2022] 1.0% Annual Population Change [2010 → 2022] | |||||||||||||||||||
| Argentina | Republic | 32,615,528 | 36,260,130 | 40,117,096 | 45,892,285 | ||||||||||||||
Source: Instituto Nacional de Estadística y Censos de la Republica Argentina.
Explanation: The results of the 2022 census are final.
Further information about the population structure:
| Gender (C 2022) | |
|---|---|
| Males | 11,681 |
| Females | 11,822 |
| Age Groups (C 2022) | |
|---|---|
| 0-14 years | 6,533 |
| 15-64 years | 15,001 |
| 65+ years | 1,969 |
| Age Distribution (C 2022) | |
|---|---|
| 90+ years | 57 |
| 80-89 years | 315 |
| 70-79 years | 867 |
| 60-69 years | 1,614 |
| 50-59 years | 2,043 |
| 40-49 years | 2,772 |
| 30-39 years | 3,258 |
| 20-29 years | 3,864 |
| 10-19 years | 4,539 |
| 0-9 years | 4,174 |
