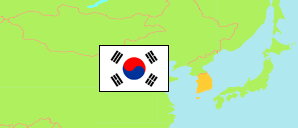
Sejong (South Korea)
Special Autonomous City
The population development of Sejong.
| Name | Native | Status | Population Census 2005-11-01 | Population Census 2010-11-01 | Population Census 2015-11-01 | Population Census 2020-11-01 | |
|---|---|---|---|---|---|---|---|
| Sejong | 세종특별자치시 | Special Autonomous City | 81,068 | 124,615 | 284,225 | 346,275 | → |
| Daehan Minguk [South Korea] | 대한민국 | Republic | 47,278,951 | 48,580,293 | 51,069,375 | 51,829,136 |
Contents: Urban Areas and Towns
The population development of the urban areas and towns in Sejong.
| Name | Native | Status | Province | Population Census 2005-11-01 | Population Census 2010-11-01 | Population Census 2015-11-01 | Population Census 2020-11-01 | |
|---|---|---|---|---|---|---|---|---|
| Jochiwon | 조치원읍 | Town | Sejong | 36,805 | 46,755 | 52,834 | 48,736 | → |
| Sejong | 세종 | Urban Area | Sejong | ... | ... | 101,099 | 252,814 | → |
Source: National Statistical Office of the Republic of Korea (web).
Explanation: Since 2015, a register-based census is performed. Nevertheless, the results are not consistent with the population figures from the resident registration that are higher by about 3.5% on average. Area figures are derived from geospatial data.