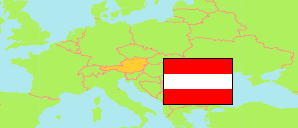
Mattersburg
District in Burgenland
District
The population development of Mattersburg.
| Name | Status | Population Census 1981-05-12 | Population Census 1991-05-15 | Population Census 2001-05-15 | Population Census 2011-10-31 | Population Census 2021-10-31 | Population Estimate 2024-01-01 | |
|---|---|---|---|---|---|---|---|---|
| Mattersburg | District | 34,408 | 35,075 | 37,445 | 39,050 | 40,563 | 40,980 | → |
| Burgenland | State | 269,771 | 270,880 | 277,558 | 285,685 | 297,506 | 301,966 |
Contents: Cities and Communes
The population development of the cities and communes in Mattersburg.
| Name | Status | District | Population Census 1981-05-12 | Population Census 1991-05-15 | Population Census 2001-05-15 | Population Census 2011-10-31 | Population Census 2021-10-31 | Population Estimate 2024-01-01 | |
|---|---|---|---|---|---|---|---|---|---|
| Antau | Commune | Mattersburg | 683 | 700 | 753 | 761 | 782 | 825 | → |
| Bad Sauerbrunn | Commune | Mattersburg | 1,675 | 1,715 | 1,914 | 2,129 | 2,264 | 2,305 | → |
| Baumgarten | Commune | Mattersburg | 864 | 880 | 880 | 894 | 902 | 926 | → |
| Draßburg | Commune | Mattersburg | 1,157 | 1,119 | 1,055 | 1,123 | 1,252 | 1,231 | → |
| Forchtenstein | Commune | Mattersburg | 2,557 | 2,678 | 2,832 | 2,793 | 2,800 | 2,792 | → |
| Hirm | Commune | Mattersburg | 810 | 843 | 907 | 944 | 1,031 | 1,094 | → |
| Krensdorf | Commune | Mattersburg | 588 | 552 | 616 | 596 | 640 | 630 | → |
| Loipersbach im Burgenland | Commune | Mattersburg | 1,136 | 1,158 | 1,269 | 1,258 | 1,190 | 1,232 | → |
| Marz | Commune | Mattersburg | 1,850 | 1,889 | 2,028 | 1,969 | 2,117 | 2,108 | → |
| Mattersburg | City | Mattersburg | 5,653 | 5,776 | 6,255 | 7,075 | 7,572 | 7,520 | → |
| Neudörfl | Commune | Mattersburg | 3,243 | 3,324 | 3,942 | 4,267 | 4,815 | 4,971 | → |
| Pöttelsdorf | Commune | Mattersburg | 581 | 587 | 638 | 694 | 772 | 765 | → |
| Pöttsching | Commune | Mattersburg | 2,139 | 2,316 | 2,679 | 2,904 | 2,985 | 3,078 | → |
| Rohrbach bei Mattersburg | Commune | Mattersburg | 2,584 | 2,669 | 2,718 | 2,716 | 2,605 | 2,625 | → |
| Schattendorf | Commune | Mattersburg | 2,539 | 2,509 | 2,465 | 2,432 | 2,388 | 2,386 | → |
| Sieggraben | Commune | Mattersburg | 1,333 | 1,393 | 1,295 | 1,301 | 1,267 | 1,256 | → |
| Sigleß | Commune | Mattersburg | 1,039 | 1,052 | 1,148 | 1,126 | 1,161 | 1,179 | → |
| Wiesen | Commune | Mattersburg | 2,695 | 2,692 | 2,779 | 2,790 | 2,758 | 2,765 | → |
| Zemendorf-Stöttera | Commune | Mattersburg | 1,282 | 1,223 | 1,272 | 1,278 | 1,262 | 1,292 | → |
Source: Statistik Austria.
Explanation: 2024 population figures are preliminary estimates