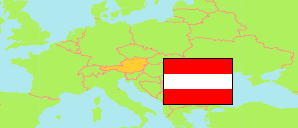
Graz (Stadt)
District in Steiermark (Austria)
Contents: Population
The population development of Graz (Stadt) as well as related information and services (Wikipedia, Google, images).
| Name | Status | Population Census 1981-05-12 | Population Census 1991-05-15 | Population Census 2001-05-15 | Population Census 2011-10-31 | Population Census 2021-10-31 | Population Estimate 2024-01-01 | |
|---|---|---|---|---|---|---|---|---|
| Graz (Stadt) | District | 243,166 | 237,810 | 226,241 | 261,726 | 291,731 | 302,660 | |
| Österreich [Austria] | Republic | 7,555,338 | 7,795,786 | 8,032,857 | 8,401,940 | 8,969,068 | 9,159,993 |
Source: Statistik Austria.
Explanation: 2024 population figures are preliminary estimates.
Further information about the population structure:
| Gender (E 2023) | |
|---|---|
| Males | 147,702 |
| Females | 150,777 |
| Age Groups (E 2023) | |
|---|---|
| 0-17 years | 47,127 |
| 18-64 years | 200,818 |
| 65+ years | 50,534 |
| Age Distribution (E 2023) | |
|---|---|
| 90+ years | 2,660 |
| 80-89 years | 13,578 |
| 70-79 years | 21,119 |
| 60-69 years | 29,770 |
| 50-59 years | 39,403 |
| 40-49 years | 37,908 |
| 30-39 years | 49,197 |
| 20-29 years | 51,845 |
| 10-19 years | 26,108 |
| 0-9 years | 26,891 |
| Citizenship (E 2023) | |
|---|---|
| Austria | 216,755 |
| EU, EEA, Switzerland | 40,169 |
| Other Citizenship | 41,555 |
| Country of Birth (E 2023) | |
|---|---|
| Austria | 209,454 |
| EU, EEA, Switzerland | 37,943 |
| Other country | 51,082 |