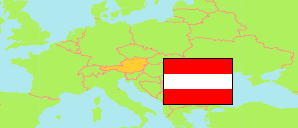
Steiermark
State in Austria
Contents: Subdivision
The population development in Steiermark as well as related information and services (Wikipedia, Google, images).
| Name | Status | Population Census 1981-05-12 | Population Census 1991-05-15 | Population Census 2001-05-15 | Population Census 2011-10-31 | Population Census 2021-10-31 | Population Estimate 2024-01-01 | |
|---|---|---|---|---|---|---|---|---|
| Steiermark [Styria] | State | 1,186,525 | 1,184,720 | 1,183,246 | 1,208,575 | 1,251,683 | 1,269,945 | |
| Bruck-Mürzzuschlag | District | 117,670 | 112,536 | 107,928 | 101,979 | 98,265 | 98,060 | → |
| Deutschlandsberg | District | 59,515 | 60,581 | 61,495 | 60,689 | 61,075 | 61,228 | → |
| Graz (Stadt) | District | 243,166 | 237,810 | 226,241 | 261,726 | 291,731 | 302,660 | → |
| Graz-Umgebung | District | 106,496 | 118,173 | 131,492 | 143,258 | 160,142 | 163,757 | → |
| Hartberg-Fürstenfeld | District | 87,659 | 89,674 | 91,403 | 90,117 | 90,884 | 91,142 | → |
| Leibnitz | District | 73,828 | 75,633 | 79,260 | 81,121 | 86,075 | 87,708 | → |
| Leoben | District | 79,154 | 72,210 | 66,745 | 61,912 | 58,941 | 59,308 | → |
| Liezen | District | 81,686 | 82,514 | 83,244 | 80,144 | 79,623 | 79,683 | → |
| Murau | District | 32,427 | 32,257 | 31,467 | 29,186 | 27,284 | 27,072 | → |
| Murtal | District | 82,748 | 79,638 | 77,877 | 73,684 | 71,291 | 71,585 | → |
| Südoststeiermark | District | 85,848 | 85,821 | 86,489 | 84,923 | 83,799 | 83,922 | → |
| Voitsberg | District | 55,806 | 54,577 | 53,588 | 52,063 | 51,073 | 51,285 | → |
| Weiz | District | 80,522 | 83,296 | 86,017 | 87,773 | 91,500 | 92,535 | → |
| Österreich [Austria] | Republic | 7,555,338 | 7,795,786 | 8,032,857 | 8,401,940 | 8,969,068 | 9,159,993 |
Source: Statistik Austria.
Explanation: 2024 population figures are preliminary estimates.
Further information about the population structure:
| Gender (E 2023) | |
|---|---|
| Males | 625,515 |
| Females | 639,683 |
| Age Groups (E 2023) | |
|---|---|
| 0-17 years | 205,426 |
| 18-64 years | 791,114 |
| 65+ years | 268,658 |
| Age Distribution (E 2023) | |
|---|---|
| 90+ years | 13,438 |
| 80-89 years | 69,545 |
| 70-79 years | 110,330 |
| 60-69 years | 167,596 |
| 50-59 years | 195,288 |
| 40-49 years | 163,984 |
| 30-39 years | 168,696 |
| 20-29 years | 146,823 |
| 10-19 years | 115,399 |
| 0-9 years | 114,099 |
| Citizenship (E 2023) | |
|---|---|
| Austria | 1,093,143 |
| EU, EEA, Switzerland | 99,972 |
| Other Citizenship | 72,083 |
| Country of Birth (E 2023) | |
|---|---|
| Austria | 1,075,894 |
| EU, EEA, Switzerland | 98,103 |
| Other country | 91,201 |