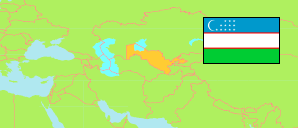
Toshkent
Region in Uzbekistan
Contents: Subdivision
The population development in Toshkent as well as related information and services (Wikipedia, Google, images).
| Name | Status | Population Estimate 2015-01-01 | Population Estimate 2020-01-01 | Population Estimate 2023-01-01 | |
|---|---|---|---|---|---|
| Toshkent [Tashkent] | Region | 2,758,298 | 2,941,908 | 2,993,453 | |
| Angren | City | ... | ... | 178,517 | → |
| Bekobod [Bekabad] | District | 146,067 | 157,323 | 163,152 | → |
| Bekobod [Bekabad] | City | 90,173 | 95,833 | 102,012 | → |
| Bo'ka [Buka] | District | 117,213 | 125,551 | 132,618 | → |
| Bo'stonliq [Bostanlik] | District | 161,814 | 168,944 | 175,295 | → |
| Chinoz [Chinaz] | District | 124,108 | 133,615 | 142,635 | → |
| Chirchiq [Chirchik] | City | 150,482 | 157,220 | 168,032 | → |
| Nurafshon (← O'rta Chirchiq) | City | ... | 48,692 | 54,130 | → |
| Ohangaron [Akhangaran] | District | ... | ... | 109,195 | → |
| Ohangaron [Akhangaran] | City | ... | 37,784 | 40,718 | → |
| Olmaliq [Almalik] | City | 122,587 | 131,111 | 141,894 | → |
| Oqqo'rg'on [Akkurgan] | District | 98,141 | 104,999 | 110,242 | → |
| O'rta Chirchiq [Urta Chirchik] | District | ... | ... | 134,732 | → |
| Parkent | District | ... | ... | 175,193 | → |
| Pskent [Piskent] | District | 95,310 | 100,727 | 101,743 | → |
| Qibray [Kibray] | District | ... | ... | 172,927 | → |
| Quyi Chirchiq [Kuyi Chirchik] | District | 101,530 | 107,888 | 114,225 | → |
| Toshkent (← Zangiota) [Tashkent] | District | ... | 180,419 | 192,826 | → |
| Yangiyo'l [Yangiyul] | District | ... | ... | 196,851 | → |
| Yangiyo'l [Yangiyul] | City | ... | ... | 81,946 | → |
| Yuqori Chirchiq [Yukari Chirchik] | District | ... | ... | 137,376 | → |
| Zangiota [Zangiata] | District | ... | ... | 167,194 | → |
| O'zbekiston [Uzbekistan] | Republic | 31,022,525 | 33,905,242 | 36,024,947 |
Source: State Committee of Statistics in Uzbekistan.
Explanation: Area figures of districts and district-level cities are computed by using geospatial data.
Further information about the population structure:
| Age Distribution (E 2023) | |
|---|---|
| 0-19 years | 1,063,807 |
| 20-39 years | 956,811 |
| 40-59 years | 649,714 |
| 60-79 years | 298,287 |
| 80+ years | 24,834 |
| Urbanization (E 2022) | |
|---|---|
| Rural | 1,463,200 |
| Urban | 1,476,500 |