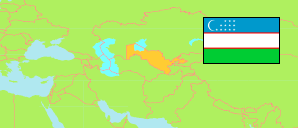
Quyi Chirchiq
District in Uzbekistan
Contents: Population
The population development of Quyi Chirchiq as well as related information and services (Wikipedia, Google, images).
| Name | Status | Population Estimate 2015-01-01 | Population Estimate 2020-01-01 | Population Estimate 2023-01-01 | |
|---|---|---|---|---|---|
| Quyi Chirchiq [Kuyi Chirchik] | District | 101,530 | 107,888 | 114,225 | |
| O'zbekiston [Uzbekistan] | Republic | 31,022,525 | 33,905,242 | 36,024,947 |
Source: State Committee of Statistics in Uzbekistan.
Explanation: Area figures of districts and district-level cities are computed by using geospatial data.
Further information about the population structure:
| Age Distribution (E 2023) | |
|---|---|
| 0-19 years | 42,351 |
| 20-39 years | 38,914 |
| 40-59 years | 22,548 |
| 60-79 years | 9,607 |
| 80+ years | 805 |
| Urbanization (E 2022) | |
|---|---|
| Rural | 85,900 |
| Urban | 26,000 |