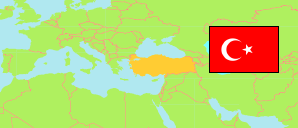
Silvan
District in Diyarbakır
District
The population development of Silvan.
| Name | Status | Population Estimate 2009-12-31 | Population Estimate 2013-12-31 | Population Estimate 2017-12-31 | Population Estimate 2022-12-31 | |
|---|---|---|---|---|---|---|
| Silvan | District | 84,807 | 86,093 | 85,256 | 86,161 | → |
| Diyarbakır | Metropolitan Province | 1,515,011 | 1,607,437 | 1,699,901 | 1,804,880 |
Contents: Cities, Towns and Villages
The population development of the cities, towns and villages in Silvan.
| Name | Status | District | Population Estimate 2009-12-31 | Population Estimate 2013-12-31 | Population Estimate 2017-12-31 | Population Estimate 2022-12-31 | |
|---|---|---|---|---|---|---|---|
| Bayrambaşı | Neighborhood | Silvan | 1,763 | 1,991 | 1,974 | 1,997 | → |
| Beypınar | Neighborhood | Silvan | 989 | 1,013 | 951 | 840 | → |
| Boyunlu | Neighborhood | Silvan | 1,101 | 1,094 | 1,188 | 1,187 | → |
| Çardak | Neighborhood | Silvan | 985 | 932 | 977 | 854 | → |
| Gökçetevek | Neighborhood | Silvan | 1,090 | 1,052 | 1,023 | 887 | → |
| Gürpınar | Neighborhood | Silvan | 940 | 872 | 856 | 825 | → |
| Kızlar | Neighborhood | Silvan | 984 | 872 | 831 | 757 | → |
| Malabadi (Çatakköprü) | Neighborhood | Silvan | 2,023 | 1,910 | 1,736 | 1,481 | → |
| Sarıbuğday | Neighborhood | Silvan | 736 | 795 | 795 | 829 | → |
| Silvan | City | Silvan | 41,484 | 44,006 | 45,472 | 48,969 | → |
| Sulubağ | Neighborhood | Silvan | 1,878 | 1,930 | 1,989 | 2,034 | → |
| Tokluca | Neighborhood | Silvan | 1,022 | 1,055 | 974 | 976 | → |
Source: State Institute of Statistics, Republic of Türkiye.
Explanation: Since 2013, the population figures of cities in metropolitan provinces are calculated by using the population of selected neighborhoods.