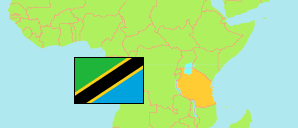
Mufindi
District in Tanzania
Contents: Population
The population development of Mufindi as well as related information and services (Wikipedia, Google, images).
| Name | Status | Population Census 1988-08-27 | Population Census 2002-08-01 | Population Census 2012-08-26 | Population Census 2022-08-23 | |
|---|---|---|---|---|---|---|
| Mufindi | District | ... | 230,856 | 246,090 | 288,996 | |
| Tanzania | United Republic | 23,174,336 | 34,443,603 | 44,928,923 | 61,741,120 |
Source: National Bureau of Statistics Tanzania.
Explanation: Area figures of districts are calculated from geospatial data.
Further information about the population structure:
| Gender (C 2022) | |
|---|---|
| Males | 138,114 |
| Females | 150,882 |
| Urbanization (C 2022) | |
|---|---|
| Rural | 278,719 |
| Urban | 10,277 |
| Age Groups (C 2022) | |
|---|---|
| 0-14 years | 116,715 |
| 15-64 years | 157,824 |
| 65+ years | 14,457 |
| Age Distribution (C 2022) | |
|---|---|
| 80+ years | 4,038 |
| 70-79 years | 6,075 |
| 60-69 years | 11,313 |
| 50-59 years | 16,650 |
| 40-49 years | 26,532 |
| 30-39 years | 35,580 |
| 20-29 years | 44,263 |
| 10-19 years | 66,916 |
| 0-9 years | 77,629 |