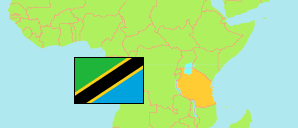
Iringa
Region in Tanzania
Contents: Subdivision
The population development in Iringa as well as related information and services (Wikipedia, Google, images).
| Name | Status | Population Census 1988-08-27 | Population Census 2002-08-01 | Population Census 2012-08-26 | Population Census 2022-08-23 | |
|---|---|---|---|---|---|---|
| Iringa | Region | ... | 840,404 | 941,238 | 1,192,728 | |
| Iringa Municipal | Municipality | 84,501 | 106,371 | 151,345 | 202,490 | → |
| Iringa Rural | District | 205,504 | 245,033 | 254,032 | 315,354 | → |
| Kilolo | District | 156,989 | 204,372 | 218,130 | 263,559 | → |
| Mafinga Town | Town | ... | ... | 71,641 | 122,329 | → |
| Mufindi | District | ... | 230,856 | 246,090 | 288,996 | → |
| Tanzania | United Republic | 23,174,336 | 34,443,603 | 44,928,923 | 61,741,120 |
Source: National Bureau of Statistics Tanzania.
Explanation: Area figures of districts are calculated from geospatial data.
Further information about the population structure:
| Gender (C 2022) | |
|---|---|
| Males | 574,313 |
| Females | 618,415 |
| Urbanization (C 2022) | |
|---|---|
| Rural | 835,669 |
| Urban | 357,059 |
| Age Groups (C 2022) | |
|---|---|
| 0-14 years | 466,568 |
| 15-64 years | 669,577 |
| 65+ years | 56,583 |
| Age Distribution (C 2022) | |
|---|---|
| 80+ years | 15,697 |
| 70-79 years | 23,665 |
| 60-69 years | 44,374 |
| 50-59 years | 66,694 |
| 40-49 years | 105,741 |
| 30-39 years | 150,941 |
| 20-29 years | 202,396 |
| 10-19 years | 265,676 |
| 0-9 years | 317,544 |