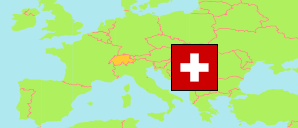
Unteriberg
in Bezirk Schwyz (Schwyz)
Contents: Commune
The population development of Unteriberg as well as related information and services (weather, Wikipedia, Google, images).
| Name | District | Population Census 1980-12-02 | Population Census 1990-12-04 | Population Census 2000-12-05 | Population Estimate 2010-12-31 | Population Estimate 2020-12-31 | Population Estimate 2023-12-31 | |
|---|---|---|---|---|---|---|---|---|
| Unteriberg | Bezirk Schwyz | 1,453 | 1,796 | 2,220 | 2,305 | 2,414 | 2,462 | → |
Source: Swiss Federal Statistical Office.
Explanation: Districts and communes in the boundaries of December 2023. The population figures for 2023 are preliminary.
Further information about the population structure:
| Gender (E 2022) | |
|---|---|
| Males | 1,251 |
| Females | 1,181 |
| Age Groups (E 2022) | |
|---|---|
| 0-17 years | 421 |
| 18-64 years | 1,553 |
| 65+ years | 458 |
| Age Distribution (E 2022) | |
|---|---|
| 90+ years | 9 |
| 80-89 years | 84 |
| 70-79 years | 198 |
| 60-69 years | 375 |
| 50-59 years | 411 |
| 40-49 years | 312 |
| 30-39 years | 304 |
| 20-29 years | 282 |
| 10-19 years | 218 |
| 0-9 years | 239 |
| Citizenship (E 2022) | |
|---|---|
| Switzerland | 2,177 |
| Germany | 113 |
| France | 10 |
| Italy | 7 |
| Portugal | 8 |
| EU (others) | 72 |
| Europe (non-EU countries) | 14 |
| Africa | 9 |
| Asia | 16 |
| Other country | 6 |
| Country of Birth (E 2022) | |
|---|---|
| Switzerland | 2,137 |
| Other country | 295 |