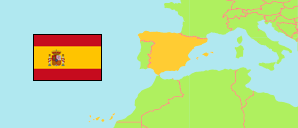
Val de San Vicente
Municipality in Cantabria Province
Municipality
The population development of Val de San Vicente.
| Name | Status | Population Estimate 2010-01-01 | Population Estimate 2015-01-01 | Population Estimate 2020-01-01 | Population Estimate 2023-01-01 | |
|---|---|---|---|---|---|---|
| Val de San Vicente | Municipality | 2,814 | 2,797 | 2,758 | 2,801 | → |
| Cantabria | Province | 592,250 | 585,179 | 582,905 | 588,387 |
Contents: Localities
The population development of the localities in Val de San Vicente.
| Name | Status | Municipality | Population Estimate 2010-01-01 | Population Estimate 2015-01-01 | Population Estimate 2020-01-01 | Population Estimate 2023-01-01 | |
|---|---|---|---|---|---|---|---|
| Abanillas | Locality | Val de San Vicente | 87 | 68 | 67 | 63 | → |
| Helgueras | Locality | Val de San Vicente | 70 | 58 | 55 | 58 | → |
| Luey | Locality | Val de San Vicente | 170 | 183 | 186 | 188 | → |
| Molleda | Locality | Val de San Vicente | 196 | 172 | 169 | 166 | → |
| Muñorrodero | Locality | Val de San Vicente | 105 | 110 | 105 | 102 | → |
| Pechón | Locality | Val de San Vicente | 220 | 233 | 227 | 227 | → |
| Pesués | Municipality seat | Val de San Vicente | 347 | 353 | 327 | 314 | → |
| Portillo | Locality | Val de San Vicente | 62 | 58 | 57 | 63 | → |
| Prellezo | Locality | Val de San Vicente | 227 | 247 | 220 | 242 | → |
| Prío | Locality | Val de San Vicente | 79 | 79 | 72 | 88 | → |
| San Pedro de las Baheras | Locality | Val de San Vicente | 61 | 58 | 51 | 50 | → |
| Serdio | Locality | Val de San Vicente | 182 | 202 | 176 | 165 | → |
| Unquera | Locality | Val de San Vicente | 990 | 958 | 1,030 | 1,040 | → |
Source: Instituto Nacional de Estadística, Madrid.
Explanation: Population of localities according to the municipal register (padrones municipales).