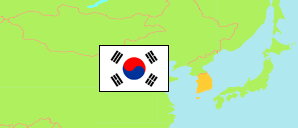
Hwaseong-si
City in Gyeonggi Province
Contents: Subdivision
The population development in Hwaseong-si as well as related information and services (Wikipedia, Google, images).
| Name | Status | Native | Population Census 2005-11-01 | Population Census 2010-11-01 | Population Census 2015-11-01 | Population Census 2020-11-01 | |
|---|---|---|---|---|---|---|---|
| Hwaseong-si | City | 화성시 | 288,718 | 488,758 | 608,725 | 880,859 | |
| Banwol-dong | Quarter | 반월동 | ... | 19,853 | 25,616 | 31,999 | → |
| Beyngjeom 1-dong | Quarter | 병점1동 | ... | 27,265 | 28,246 | 28,222 | → |
| Beyngjeom 2-dong | Quarter | 병점2동 | ... | 26,911 | 26,605 | 24,264 | → |
| Bibong-myeon | Rural Township | 비봉면 | 5,384 | 5,427 | 6,227 | 6,326 | → |
| Bongdam-eup | Town | 봉담읍 | 29,746 | 65,253 | 71,625 | 83,193 | → |
| Dongtan 1-dong | Quarter | 동탄1동 | ... | 44,419 | 52,132 | 50,551 | → |
| Dongtan 2-dong | Quarter | 동탄2동 | ... | 32,215 | 36,409 | 35,360 | → |
| Dongtan 3-dong | Quarter | 동탄3동 | ... | 38,296 | 43,362 | 41,643 | → |
| Dongtan 4-dong | Quarter | 동탄4동 | ... | ... | ... | 52,087 | → |
| Dongtan 5-dong | Quarter | 동탄5동 | ... | ... | ... | 39,907 | → |
| Dongtan 6-dong | Quarter | 동탄6동 | ... | ... | ... | 30,734 | → |
| Dongtan 7-dong | Quarter | 동탄7동 | ... | ... | ... | 80,735 | → |
| Dongtan 8-dong | Quarter | 동탄8동 | ... | ... | ... | 26,066 | → |
| Gibae-dong | Quarter | 기배동 | ... | 14,858 | 15,062 | 13,712 | → |
| Hwasan-dong | Quarter | 화산동 | ... | 23,298 | 23,896 | 23,581 | → |
| Hyangnam-eup | Town | 향남읍 | 15,602 | 51,105 | 72,578 | 95,787 | → |
| Jangan-myeon | Rural Township | 장안면 | 10,284 | 10,057 | 14,382 | 14,299 | → |
| Jeongnam-myeon | Rural Township | 정남면 | 12,855 | 12,543 | 14,721 | 14,201 | → |
| Jinan-dong | Quarter | 진안동 | ... | 35,416 | 36,571 | 44,433 | → |
| Mado-myeon | Rural Township | 마도면 | 4,865 | 5,372 | 7,793 | 9,372 | → |
| Maesong-myeon | Rural Township | 매송면 | 7,659 | 6,912 | 8,052 | 7,139 | → |
| Namyang-eup | Town | 남양읍 | 20,840 | 22,051 | 27,091 | 44,258 | → |
| Paltan-myeon | Rural Township | 팔탄면 | 10,043 | 10,229 | 14,212 | 15,186 | → |
| Saesol-dong | Quarter | 새솔동 | ... | ... | ... | 21,333 | → |
| Seosin-myeon | Rural Township | 서신면 | 4,782 | 4,837 | 6,865 | 7,672 | → |
| Songsan-myeon | Rural Township | 송산면 | 9,389 | 8,835 | 10,826 | 11,425 | → |
| Ujeong-eup | Town | 우정읍 | 18,341 | 15,065 | 19,628 | 20,748 | → |
| Yanggam-myeon | Rural Township | 양감면 | 4,364 | 3,844 | 6,529 | 6,626 | → |
| Gyeonggi-do | Province | 경기도 | 10,415,399 | 11,379,459 | 12,479,061 | 13,511,676 |
Source: National Statistical Office of the Republic of Korea (web).
Explanation: Since 2015, a register-based census is performed. Nevertheless, the results are not consistent with the population figures from the resident registration that are higher by about 3.5% on average. Area figures are derived from geospatial data.
Further information about the population structure:
| Gender (C 2020) | |
|---|---|
| Males | 464,634 |
| Females | 416,225 |
| Age Groups (C 2020) | |
|---|---|
| 0-14 years | 157,701 |
| 15-64 years | 648,864 |
| 65+ years | 74,294 |
| Age Distribution (C 2020) | |
|---|---|
| 90+ years | 1,975 |
| 80-89 years | 14,027 |
| 70-79 years | 31,436 |
| 60-69 years | 68,758 |
| 50-59 years | 117,117 |
| 40-49 years | 166,761 |
| 30-39 years | 167,452 |
| 20-29 years | 113,902 |
| 10-19 years | 93,890 |
| 0-9 years | 105,541 |
| Citizenship (C 2020) | |
|---|---|
| Korea | 825,922 |
| Foreign Citizenship | 54,937 |