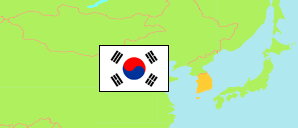
Gyeonggi-do
Province in South Korea
Contents: Subdivision
The population development in Gyeonggi-do as well as related information and services (Wikipedia, Google, images).
| Name | Status | Native | Population Census 1980-11-01 | Population Census 1990-11-01 | Population Census 2000-11-01 | Population Census 2010-11-01 | Population Census 2015-11-01 | Population Census 2020-11-01 | |
|---|---|---|---|---|---|---|---|---|---|
| Gyeonggi-do | Province | 경기도 | 3,703,761 | 6,050,943 | 8,984,134 | 11,379,459 | 12,479,061 | 13,511,676 | |
| Ansan-si | City | 안산시 | 37,517 | 240,972 | 562,920 | 728,775 | 747,035 | 717,345 | → |
| Anseong-si | City | 안성시 | 127,934 | 118,285 | 133,421 | 179,782 | 194,765 | 203,030 | → |
| Anyang-si | City | 안양시 | 253,560 | 481,291 | 580,544 | 602,122 | 585,177 | 542,336 | → |
| Bucheon-si | City | 부천시 | 221,463 | 667,993 | 761,389 | 853,039 | 843,794 | 833,148 | → |
| Dongducheon-si | City | 동두천시 | 60,144 | 71,449 | 73,502 | 91,828 | 97,424 | 95,239 | → |
| Gapyeong-gun | County | 가평군 | 62,007 | 50,957 | 52,147 | 50,879 | 58,909 | 60,233 | → |
| Gimpo-si | City | 김포시 | 74,973 | 96,750 | 150,194 | 224,350 | 352,683 | 474,546 | → |
| Goyang-si | City | 고양시 | 155,601 | 244,975 | 763,971 | 905,076 | 990,073 | 1,045,497 | → |
| Gunpo-si | City | 군포시 | 40,253 | 124,313 | 263,760 | 278,083 | 285,721 | 275,571 | → |
| Guri-si | City | 구리시 | 66,490 | 109,374 | 160,839 | 185,550 | 180,063 | 192,051 | → |
| Gwacheon-si | City | 과천시 | 16,074 | 72,353 | 66,706 | 66,704 | 64,817 | 58,018 | → |
| Gwangju-si | City | 광주시 | 57,367 | 76,593 | 125,943 | 228,747 | 310,278 | 385,141 | → |
| Gwangmyeong-si | City | 광명시 | 145,870 | 328,593 | 334,089 | 329,010 | 338,509 | 298,116 | → |
| Hanam-si | City | 하남시 | 49,379 | 101,325 | 120,513 | 138,829 | 154,838 | 279,795 | → |
| Hwaseong-si | City | 화성시 | 160,067 | 170,779 | 189,467 | 488,758 | 608,725 | 880,859 | → |
| Icheon-si | City | 이천시 | 109,219 | 148,719 | 179,719 | 195,175 | 209,003 | 226,212 | → |
| Namyangju-si | City | 남양주시 | 124,989 | 200,312 | 340,932 | 529,898 | 629,061 | 696,033 | → |
| Osan-si | City | 오산시 | 44,840 | 59,482 | 102,697 | 183,890 | 213,840 | 240,645 | → |
| Paju-si | City | 파주시 | 165,098 | 185,028 | 178,434 | 328,128 | 415,345 | 460,541 | → |
| Pocheon-si | City | 포천시 | 107,653 | 110,958 | 138,654 | 140,997 | 163,388 | 157,939 | → |
| Pyeongtaek-si | City | 평택시 | 234,356 | 271,826 | 345,306 | 388,508 | 457,873 | 542,522 | → |
| Seongnam-si | City | 성남시 | 376,840 | 540,754 | 914,590 | 949,964 | 948,757 | 922,025 | → |
| Siheung-si | City | 시흥시 | 53,874 | 99,209 | 305,268 | 407,090 | 425,184 | 535,147 | → |
| Suwon-si | City | 수원시 | 322,659 | 661,396 | 946,704 | 1,071,913 | 1,194,313 | 1,210,150 | → |
| Uijeongbu-si | City | 의정부시 | 133,177 | 212,352 | 355,380 | 417,412 | 421,579 | 449,572 | → |
| Uiwang-si | City | 의왕시 | 32,842 | 96,892 | 117,821 | 144,501 | 154,879 | 160,230 | → |
| Yangju-si | City | 양주시 | 73,780 | 84,672 | 110,299 | 187,911 | 205,988 | 233,286 | → |
| Yangpyeong-gun | County | 양평군 | 93,408 | 77,166 | 75,706 | 82,802 | 101,930 | 113,844 | → |
| Yeoju | City | 여주시 | 98,236 | 96,895 | 97,612 | 101,203 | 109,937 | 113,352 | → |
| Yeoncheon-gun | County | 연천군 | 68,519 | 61,287 | 49,483 | 41,770 | 43,846 | 42,278 | → |
| Yongin-si | City | 용인시 | 135,572 | 187,993 | 386,124 | 856,765 | 971,327 | 1,066,975 | → |
| Daehan Minguk [South Korea] | Republic | 대한민국 | 37,436,315 | 43,410,899 | 46,136,101 | 48,580,293 | 51,069,375 | 51,829,136 |
Source: National Statistical Office of the Republic of Korea (web).
Explanation: Since 2015, a register-based census is performed. Nevertheless, the results are not consistent with the population figures from the resident registration that are higher by about 3.5% on average.
Further information about the population structure:
| Gender (C 2020) | |
|---|---|
| Males | 6,828,367 |
| Females | 6,683,309 |
| Age Groups (C 2020) | |
|---|---|
| 0-14 years | 1,794,750 |
| 15-64 years | 9,958,841 |
| 65+ years | 1,758,085 |
| Age Distribution (C 2020) | |
|---|---|
| 90+ years | 52,492 |
| 80-89 years | 347,111 |
| 70-79 years | 759,262 |
| 60-69 years | 1,522,931 |
| 50-59 years | 2,245,977 |
| 40-49 years | 2,303,396 |
| 30-39 years | 2,002,793 |
| 20-29 years | 1,828,442 |
| 10-19 years | 1,294,945 |
| 0-9 years | 1,154,327 |
| Citizenship (C 2020) | |
|---|---|
| Korea | 12,928,214 |
| Foreign Citizenship | 583,462 |