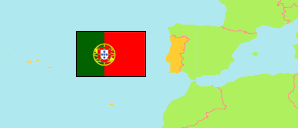
Faro (Portugal)
District
The population development of Faro.
| Name | Status | Population Census 2001-03-12 | Population Census 2011-03-21 | Population Census 2021-03-22 | |
|---|---|---|---|---|---|
| Faro | District | 395,218 | 451,006 | 467,343 | → |
| Portugal | Republic | 10,356,117 | 10,562,178 | 10,343,066 |
Contents: Urban Areas
The population development of the urban areas in Faro.
| Name | Status | District / Region | Population Census 2001-03-12 | Population Census 2011-03-21 | Population Census 2021-03-22 | |
|---|---|---|---|---|---|---|
| Albufeira e Olhos de Água | Urban Area | Faro | 19,458 | 26,742 | 28,641 | → |
| Almancil | Urban Area | Faro | 8,799 | 10,677 | 11,291 | → |
| Alvor | Urban Area | Faro | 4,977 | 6,154 | 6,314 | → |
| Armação de Pêra | Urban Area | Faro | 3,770 | 4,867 | 6,003 | → |
| Faro | Urban Area | Faro | 41,307 | 44,578 | 46,299 | → |
| Ferreiras | Urban Area | Faro | 4,951 | 6,406 | 7,267 | → |
| Lagoa | Urban Area | Faro | 8,847 | 9,987 | 10,141 | → |
| Lagos | Urban Area | Faro | 17,471 | 22,095 | 23,648 | → |
| Loulé | Urban Area | Faro | 14,406 | 17,358 | 17,930 | → |
| Monte Gordo | Urban Area | Faro | 3,952 | 3,308 | 3,197 | → |
| Montenegro | Urban Area | Faro | 5,336 | 8,149 | 8,613 | → |
| Olhão | Urban Area | Faro | 28,038 | 32,160 | 31,459 | → |
| Portimão | Urban Area | Faro | 36,243 | 45,431 | 49,218 | → |
| Quarteira | Urban Area | Faro | 16,129 | 21,798 | 24,420 | → |
| São Brás de Alportel | Urban Area | Faro | 10,032 | 10,662 | 11,248 | → |
| Silves | Urban Area | Faro | 10,768 | 11,014 | 10,661 | → |
| Tavira | Urban Area | Faro | 12,576 | 15,133 | 15,432 | → |
| Vila Real de Santo António | Urban Area | Faro | 10,542 | 11,946 | 11,754 | → |
Source: Instituto Nacional de Estatística Portugal (web).
Explanation: The territorial units consist of predominant urban parishes (freguesias) as defined by TIPAU 2014 (Tipologia de Áreas Urbanas). The tabulated population figures are computed by »City Population«.