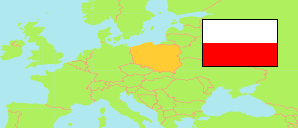
Powiat suski
County in Lesser Poland Voivodeship
Contents: Subdivision
The population development in Powiat suski as well as related information and services (Wikipedia, Google, images).
| Name | Status | Population Census 2002-05-20 | Population Census 2011-03-31 | Population Census 2021-03-31 | |
|---|---|---|---|---|---|
| Powiat suski [Sucha County] | County | 81,128 | 83,829 | 83,324 | |
| Budzów | Rural Commune | 8,160 | 8,616 | 8,819 | → |
| Bystra-Sidzina | Rural Commune | 6,293 | 6,700 | 6,820 | → |
| Jordanów | Urban Commune | 5,041 | 5,299 | 5,313 | → |
| Jordanów (gm.w.) | Rural Commune | 10,330 | 10,782 | 11,175 | → |
| Maków Podhalański | Urban-Rural Commune | 15,715 | 16,326 | 15,888 | → |
| Stryszawa | Rural Commune | 11,678 | 11,807 | 11,997 | → |
| Sucha Beskidzka | Urban Commune | 9,662 | 9,557 | 8,951 | → |
| Zawoja | Rural Commune | 8,710 | 9,106 | 8,893 | → |
| Zembrzyce | Rural Commune | 5,539 | 5,636 | 5,468 | → |
| Małopolskie [Lesser Poland] | Voivodeship | 3,240,730 | 3,337,471 | 3,432,295 |
Source: Główny Urząd Statystyczny, Warszawa (web).
Further information about the population structure:
| Gender (C 2021) | |
|---|---|
| Males | 41,181 |
| Females | 42,143 |
| Age Groups (C 2021) | |
|---|---|
| 0-17 years | 16,995 |
| 18-64 years | 52,597 |
| 65+ years | 13,732 |
| Age Distribution (C 2021) | |
|---|---|
| 90+ years | 512 |
| 80-89 years | 3,055 |
| 70-79 years | 5,562 |
| 60-69 years | 9,828 |
| 50-59 years | 10,413 |
| 40-49 years | 11,913 |
| 30-39 years | 12,586 |
| 20-29 years | 10,593 |
| 10-19 years | 9,667 |
| 0-9 years | 9,195 |
| Urbanization (C 2021) | |
|---|---|
| Rural | 63,435 |
| Urban | 19,889 |