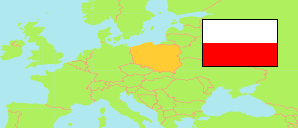
Powiat limanowski
County in Lesser Poland Voivodeship
Contents: Subdivision
The population development in Powiat limanowski as well as related information and services (Wikipedia, Google, images).
| Name | Status | Population Census 2002-05-20 | Population Census 2011-03-31 | Population Census 2021-03-31 | |
|---|---|---|---|---|---|
| Powiat limanowski [Limanowa County] | County | 118,818 | 126,816 | 131,227 | |
| Dobra | Rural Commune | 9,339 | 9,672 | 10,035 | → |
| Jodłownik | Rural Commune | 7,983 | 8,264 | 8,711 | → |
| Kamienica | Rural Commune | 7,086 | 7,647 | 7,813 | → |
| Laskowa | Rural Commune | 7,241 | 7,810 | 8,114 | → |
| Limanowa | Urban Commune | 14,391 | 15,146 | 14,635 | → |
| Limanowa (gm.w.) | Rural Commune | 22,309 | 24,016 | 25,745 | → |
| Łukowica | Rural Commune | 9,002 | 9,639 | 10,090 | → |
| Mszana Dolna | Urban Commune | 7,326 | 7,792 | 7,854 | → |
| Mszana Dolna (gm.w.) | Rural Commune | 15,957 | 17,054 | 17,653 | → |
| Niedźwiedź | Rural Commune | 6,550 | 7,125 | 7,318 | → |
| Słopnice | Rural Commune | 5,665 | 6,264 | 6,823 | → |
| Tymbark | Rural Commune | 5,969 | 6,387 | 6,436 | → |
| Małopolskie [Lesser Poland] | Voivodeship | 3,240,730 | 3,337,471 | 3,432,295 |
Source: Główny Urząd Statystyczny, Warszawa (web).
Further information about the population structure:
| Gender (C 2021) | |
|---|---|
| Males | 65,613 |
| Females | 65,614 |
| Age Groups (C 2021) | |
|---|---|
| 0-17 years | 31,344 |
| 18-64 years | 81,809 |
| 65+ years | 18,074 |
| Age Distribution (C 2021) | |
|---|---|
| 90+ years | 727 |
| 80-89 years | 4,144 |
| 70-79 years | 7,352 |
| 60-69 years | 13,128 |
| 50-59 years | 15,808 |
| 40-49 years | 17,814 |
| 30-39 years | 19,414 |
| 20-29 years | 18,118 |
| 10-19 years | 17,117 |
| 0-9 years | 17,605 |
| Urbanization (C 2021) | |
|---|---|
| Rural | 108,738 |
| Urban | 22,489 |