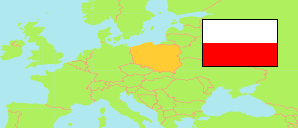
Powiat krakowski
County in Lesser Poland Voivodeship
Contents: Subdivision
The population development in Powiat krakowski as well as related information and services (Wikipedia, Google, images).
| Name | Status | Population Census 2002-05-20 | Population Census 2011-03-31 | Population Census 2021-03-31 | |
|---|---|---|---|---|---|
| Powiat krakowski [Kraków County] | County | 238,257 | 259,706 | 296,570 | |
| Czernichów | Rural Commune | 12,701 | 13,630 | 15,139 | → |
| Igołomia-Wawrzeńczyce | Rural Commune | 7,694 | 7,759 | 7,910 | → |
| Iwanowice | Rural Commune | 8,016 | 8,552 | 9,735 | → |
| Jerzmanowice-Przeginia | Rural Commune | 10,349 | 10,630 | 11,195 | → |
| Kocmyrzów-Luborzyca | Rural Commune | 12,732 | 14,124 | 17,566 | → |
| Krzeszowice | Urban-Rural Commune | 31,327 | 32,305 | 32,142 | → |
| Liszki | Rural Commune | 14,886 | 16,179 | 18,117 | → |
| Michałowice | Rural Commune | 7,178 | 9,227 | 12,738 | → |
| Mogilany | Rural Commune | 10,259 | 12,497 | 15,859 | → |
| Skała | Urban-Rural Commune | 9,491 | 10,052 | 10,910 | → |
| Skawina | Urban-Rural Commune | 41,099 | 42,679 | 44,022 | → |
| Słomniki | Urban-Rural Commune | 13,568 | 13,789 | 13,851 | → |
| Sułoszowa | Rural Commune | 5,893 | 5,828 | 5,784 | → |
| Świątniki Górne | Urban-Rural Commune | 8,476 | 9,291 | 10,945 | → |
| Wielka Wieś | Rural Commune | 8,803 | 10,363 | 15,375 | → |
| Zabierzów | Rural Commune | 21,452 | 24,220 | 28,912 | → |
| Zielonki | Rural Commune | 14,333 | 18,581 | 26,370 | → |
| Małopolskie [Lesser Poland] | Voivodeship | 3,240,730 | 3,337,471 | 3,432,295 |
Source: Główny Urząd Statystyczny, Warszawa (web).
Further information about the population structure:
| Gender (C 2021) | |
|---|---|
| Males | 145,513 |
| Females | 151,057 |
| Age Groups (C 2021) | |
|---|---|
| 0-17 years | 62,931 |
| 18-64 years | 186,712 |
| 65+ years | 46,927 |
| Age Distribution (C 2021) | |
|---|---|
| 90+ years | 1,745 |
| 80-89 years | 9,122 |
| 70-79 years | 19,168 |
| 60-69 years | 35,356 |
| 50-59 years | 35,456 |
| 40-49 years | 48,170 |
| 30-39 years | 46,817 |
| 20-29 years | 31,808 |
| 10-19 years | 33,663 |
| 0-9 years | 35,265 |
| Urbanization (C 2021) | |
|---|---|
| Rural | 252,047 |
| Urban | 44,523 |