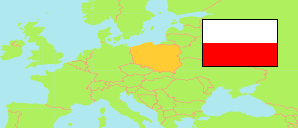
Powiat gorlicki
County in Lesser Poland Voivodeship
Contents: Subdivision
The population development in Powiat gorlicki as well as related information and services (Wikipedia, Google, images).
| Name | Status | Population Census 2002-05-20 | Population Census 2011-03-31 | Population Census 2021-03-31 | |
|---|---|---|---|---|---|
| Powiat gorlicki [Gorlice County] | County | 106,185 | 109,155 | 106,818 | |
| Biecz | Urban-Rural Commune | 16,928 | 17,089 | 16,464 | → |
| Bobowa | Urban-Rural Commune | 9,063 | 9,497 | 9,576 | → |
| Gorlice | Urban Commune | 29,005 | 28,819 | 26,405 | → |
| Gorlice (gm.w.) | Rural Commune | 15,790 | 16,917 | 17,042 | → |
| Lipinki | Rural Commune | 6,793 | 6,814 | 6,760 | → |
| Łużna | Rural Commune | 8,052 | 8,365 | 8,397 | → |
| Moszczenica | Rural Commune | 4,717 | 4,856 | 4,916 | → |
| Ropa | Rural Commune | 4,931 | 5,288 | 5,530 | → |
| Sękowa | Rural Commune | 4,674 | 4,891 | 4,881 | → |
| Uście Gorlickie | Rural Commune | 6,232 | 6,619 | 6,847 | → |
| Małopolskie [Lesser Poland] | Voivodeship | 3,240,730 | 3,337,471 | 3,432,295 |
Source: Główny Urząd Statystyczny, Warszawa (web).
Further information about the population structure:
| Gender (C 2021) | |
|---|---|
| Males | 52,811 |
| Females | 54,007 |
| Age Groups (C 2021) | |
|---|---|
| 0-17 years | 21,514 |
| 18-64 years | 66,774 |
| 65+ years | 18,530 |
| Age Distribution (C 2021) | |
|---|---|
| 90+ years | 683 |
| 80-89 years | 4,210 |
| 70-79 years | 7,423 |
| 60-69 years | 13,389 |
| 50-59 years | 13,715 |
| 40-49 years | 15,160 |
| 30-39 years | 16,066 |
| 20-29 years | 12,394 |
| 10-19 years | 12,174 |
| 0-9 years | 11,604 |
| Urbanization (C 2021) | |
|---|---|
| Rural | 72,874 |
| Urban | 33,944 |