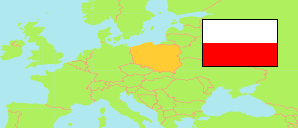
Powiat chrzanowski
County in Lesser Poland Voivodeship
Contents: Subdivision
The population development in Powiat chrzanowski as well as related information and services (Wikipedia, Google, images).
| Name | Status | Population Census 2002-05-20 | Population Census 2011-03-31 | Population Census 2021-03-31 | Population Estimate 2023-12-31 | |
|---|---|---|---|---|---|---|
| Powiat chrzanowski [Chrzanów County] | County | 129,066 | 127,948 | 121,485 | 118,684 | |
| Alwernia | Urban-Rural Commune | 12,473 | 12,725 | 12,484 | 12,354 | → |
| Babice | Rural Commune | 8,596 | 8,958 | 9,067 | 8,985 | → |
| Chrzanów | Urban-Rural Commune | 50,834 | 48,967 | 45,226 | 43,941 | → |
| Libiąż | Urban-Rural Commune | 22,937 | 22,816 | 21,648 | 21,083 | → |
| Trzebinia | Urban-Rural Commune | 34,226 | 34,482 | 33,060 | 32,321 | → |
| Małopolskie [Lesser Poland] | Voivodeship | 3,240,730 | 3,337,471 | 3,432,295 | 3,429,632 |
Source: Główny Urząd Statystyczny, Warszawa.
Further information about the population structure:
| Gender (E 2023) | |
|---|---|
| Males | 57,263 |
| Females | 61,421 |
| Age Groups (E 2023) | |
|---|---|
| 0-17 years | 19,484 |
| 18-64 years | 72,637 |
| 65+ years | 26,563 |
| Age Distribution (E 2023) | |
|---|---|
| 80+ years | 5,953 |
| 70-79 years | 11,652 |
| 60-69 years | 17,498 |
| 50-59 years | 15,483 |
| 40-49 years | 19,380 |
| 30-39 years | 16,175 |
| 20-29 years | 10,987 |
| 10-19 years | 11,527 |
| 0-9 years | 10,029 |
| Urbanization (E 2023) | |
|---|---|
| Rural | 47,098 |
| Urban | 71,586 |
| Citizenship (C 2021) | |
|---|---|
| Poland | 121,293 |
| Other Citizenship | 192 |
| Country of Birth (C 2021) | |
|---|---|
| Poland | 120,047 |
| Other country | 1,407 |