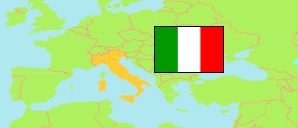
Prato
Province in Italy
Contents: Population
The population development of Prato as well as related information and services (Wikipedia, Google, images).
| Name | Status | Population Census 1981-10-25 | Population Census 1991-10-20 | Population Census 2001-10-21 | Population Census 2011-10-09 | Population Evaluation 2022-01-01 | Population Evaluation 2024-01-01 | |
|---|---|---|---|---|---|---|---|---|
| Prato | Province | 206,374 | 217,244 | 227,886 | 245,916 | 258,123 | 260,972 | |
| Italia [Italy] | Republic | 56,556,911 | 56,778,031 | 56,995,744 | 59,433,744 | 59,030,133 | 58,989,749 |
Source: Istituto Nazionale di Statistica Italia.
Explanation: Population figures for 2022 and later are result of a sampling survey combined with an evaluation of registers. The 2024 figures are preliminary.
Further information about the population structure:
| Gender (R 2024) | |
|---|---|
| Males | 128,477 |
| Females | 132,495 |
| Age Groups (R 2024) | |
|---|---|
| 0-17 years | 40,261 |
| 18-64 years | 161,067 |
| 65+ years | 59,644 |
| Age Distribution (R 2024) | |
|---|---|
| 90+ years | 3,721 |
| 80-89 years | 15,882 |
| 70-79 years | 25,262 |
| 60-69 years | 32,129 |
| 50-59 years | 43,245 |
| 40-49 years | 38,922 |
| 30-39 years | 30,292 |
| 20-29 years | 25,766 |
| 10-19 years | 26,630 |
| 0-9 years | 19,123 |
| Citizenship (R 2024) | |
|---|---|
| Italy | 202,441 |
| Foreign Citizenship | 58,531 |