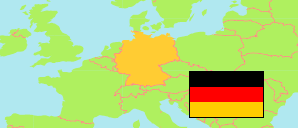
Miltenberg
County in Bayern (Germany)
Contents: Population
The population development of Miltenberg as well as related information and services (Wikipedia, Google, images).
| Name | Status | Population Estimate 1990-12-31 | Population Estimate 2001-12-31 | Population Census 2011-05-09 | Population Census 2022-05-15 | Population Estimate 2024-12-31 | |
|---|---|---|---|---|---|---|---|
| Miltenberg | County | 120,328 | 131,369 | 128,406 | 126,496 | 127,547 | |
| Deutschland [Germany] | Federal Republic | 79,753,227 | 82,440,309 | 80,219,695 | 82,711,282 | 83,577,140 |
Source: Statistisches Bundesamt Deutschland, Statistical Offices of the German States.
Explanation: Border status: December 31, 2024. For privacy reasons, the statistical office skewed the 2022 census numbers by small amounts. To avoid inconsistencies and negative values, further adjustments are applied here. The 2022 total population of Germany exclude 8,258 persons posted abroad.
Further information about the population structure:
| Gender (E 2024) | |
|---|---|
| Males | 63,368 |
| Females | 64,179 |
| Age Groups (E 2024) | |
|---|---|
| 0-17 years | 21,565 |
| 18-64 years | 76,309 |
| 65+ years | 29,673 |
| Age Distribution (C 2022) | |
|---|---|
| 90+ years | 1,177 |
| 80-89 years | 7,909 |
| 70-79 years | 11,029 |
| 60-69 years | 18,178 |
| 50-59 years | 21,364 |
| 40-49 years | 15,279 |
| 30-39 years | 15,071 |
| 20-29 years | 12,851 |
| 10-19 years | 11,741 |
| 0-9 years | 11,896 |
| Religion (C 2022) | |
|---|---|
| Roman Catholics | 67,293 |
| Protestants | 13,371 |
| Other/No/Unknown | 45,832 |
| Citizenship (C 2022) | |
|---|---|
| Germany | 111,918 |
| EU 27 (2020) | 5,735 |
| Other Citizenship | 8,843 |
| Citizenship (C 2022) | |
|---|---|
| German | 111,918 |
| Poland | 875 |
| Turkey | 4,213 |
| Romania | 1,279 |
| Ukraine | 867 |
| Syria | 930 |
| Italy | 937 |
| Other country | 5,477 |
| Region of Birth (C 2022) | |
|---|---|
| Germany | 105,427 |
| EU 27 (2020) | 7,850 |
| Other country | 13,219 |
| Country of Birth (C 2022) | |
|---|---|
| Germany | 105,427 |
| Poland | 1,712 |
| Turkey | 3,874 |
| Russia | 1,323 |
| Romania | 1,741 |
| Kazakhstan | 2,051 |
| Ukraine | 973 |
| Syria | 854 |
| Italy | 755 |
| Other country | 7,786 |