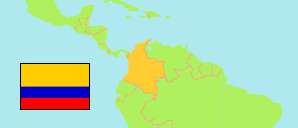
San Miguel
Municipality in Putumayo
Municipality
The population development of San Miguel.
| Name | Status | Population Census 2005-06-30 | Population Census 2018-06-30 | |
|---|---|---|---|---|
| San Miguel | Municipality | 21,838 | 18,780 | → |
| Putumayo | Department | 244,260 | 285,225 |
Contents: Urban Localities
The population development of the urban localities in San Miguel.
| Name | Status | Municipality | Population Census 2005-06-30 | Population Census 2018-06-30 | |
|---|---|---|---|---|---|
| Agua Blanca | Population Center | San Miguel | ... | 189 | → |
| El Chiguaco | Population Center | San Miguel | ... | 41 | → |
| El Maizal | Population Center | San Miguel | ... | 97 | → |
| El Paraíso | Population Center | San Miguel | ... | 69 | → |
| Jordán Ortiz | Population Center | San Miguel | ... | 156 | → |
| La Dorada | Capital | San Miguel | 3,485 | 4,912 | → |
| La Guisita | Population Center | San Miguel | ... | 54 | → |
| La Invasión | Population Center | San Miguel | ... | 42 | → |
| Los Uvos | Population Center | San Miguel | ... | 72 | → |
| Mesas del Sabalito | Population Center | San Miguel | ... | 100 | → |
| Nueva Risaralda | Population Center | San Miguel | ... | 121 | → |
| Puerto Colón | Population Center | San Miguel | ... | 1,215 | → |
| San Luis de la Frontera | Population Center | San Miguel | ... | 146 | → |
Source: Departamento Administrativo Nacional de Estadistica, Republica de Columbia (web).
Explanation: In constrast to municipalities and their capitals, the population figures of population centers are not adjusted for underenumeration.