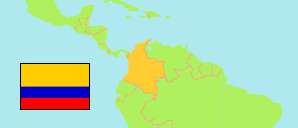
La Plata
Municipality in Huila
Municipality
The population development of La Plata.
| Name | Status | Population Census 2005-06-30 | Population Census 2018-06-30 | |
|---|---|---|---|---|
| La Plata | Municipality | 52,189 | 61,026 | → |
| Huila | Department | 1,022,844 | 1,057,179 |
Contents: Urban Localities
The population development of the urban localities in La Plata.
| Name | Status | Municipality | Population Census 2005-06-30 | Population Census 2018-06-30 | |
|---|---|---|---|---|---|
| Belén | Population Center | La Plata | 1,223 | 945 | → |
| Gallego | Population Center | La Plata | 426 | 391 | → |
| La Plata | Capital | La Plata | 21,184 | 25,791 | → |
| Monserrate | Population Center | La Plata | 523 | 644 | → |
| San Andrés | Population Center | La Plata | 299 | 335 | → |
| San Vicente | Population Center | La Plata | 203 | 153 | → |
| Villa Losada | Population Center | La Plata | 459 | 495 | → |
Source: Departamento Administrativo Nacional de Estadistica, Republica de Columbia (web).
Explanation: In constrast to municipalities and their capitals, the population figures of population centers are not adjusted for underenumeration.