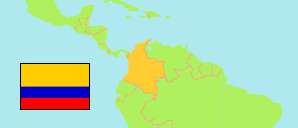
Unguía
Municipality in Chocó
Municipality
The population development of Unguía.
| Name | Status | Population Census 2005-06-30 | Population Census 2018-06-30 | |
|---|---|---|---|---|
| Unguía | Municipality | 14,544 | 12,854 | → |
| Chocó | Department | 399,303 | 458,775 |
Contents: Urban Localities
The population development of the urban localities in Unguía.
| Name | Status | Municipality | Population Census 2005-06-30 | Population Census 2018-06-30 | |
|---|---|---|---|---|---|
| Arquia | Population Center | Unguía | ... | 329 | → |
| Balboa | Population Center | Unguía | 880 | 1,090 | → |
| Betecito | Population Center | Unguía | ... | 40 | → |
| El Puerto | Population Center | Unguía | ... | 312 | → |
| Gilgal | Population Center | Unguía | 668 | 785 | → |
| Marriaga | Population Center | Unguía | ... | 118 | → |
| Santa María del Darién | Population Center | Unguía | 657 | 536 | → |
| Tanela | Population Center | Unguía | ... | 617 | → |
| Titumate | Population Center | Unguía | 303 | 330 | → |
| Unguía | Capital | Unguía | 3,309 | 4,343 | → |
Source: Departamento Administrativo Nacional de Estadistica, Republica de Columbia (web).
Explanation: In constrast to municipalities and their capitals, the population figures of population centers are not adjusted for underenumeration.