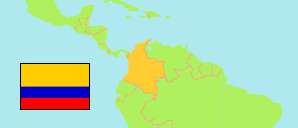
El Bagre
in El Bagre (Antioquia)
Contents: Capital
The population development of El Bagre as well as related information and services (weather, Wikipedia, Google, images).
| Name | Municipality | Population Census 2005-06-30 | Population Census 2018-06-30 | |
|---|---|---|---|---|
| El Bagre | El Bagre | 25,101 | 32,823 | → |
Source: Departamento Administrativo Nacional de Estadistica, Republica de Columbia (web).
Explanation: In constrast to municipalities and their capitals, the population figures of population centers are not adjusted for underenumeration.
Further information about the population structure:
| Gender (C 2018) | |
|---|---|
| Males | 15,879 |
| Females | 16,944 |
| Age Groups (C 2018) | |
|---|---|
| 0-14 years | 9,145 |
| 15-64 years | 18,771 |
| 65+ years | 1,672 |
| Age Distribution (C 2018) | |
|---|---|
| 0-9 years | 5,601 |
| 10-19 years | 6,736 |
| 20-29 years | 5,002 |
| 30-39 years | 4,150 |
| 40-49 years | 2,888 |
| 50-59 years | 2,668 |
| 60-69 years | 1,482 |
| 70-79 years | 684 |
| 80-89 years | 319 |
| 90+ years | 58 |