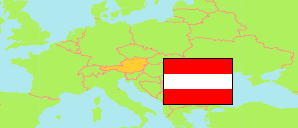
Rust (Stadt)
District in Burgenland
District
The population development of Rust (Stadt).
| Name | Status | Population Census 1981-05-12 | Population Census 1991-05-15 | Population Census 2001-05-15 | Population Census 2011-10-31 | Population Census 2021-10-31 | Population Estimate 2024-01-01 | |
|---|---|---|---|---|---|---|---|---|
| Rust (Stadt) | District | 1,693 | 1,696 | 1,714 | 1,896 | 1,984 | 1,984 | → |
| Burgenland | State | 269,771 | 270,880 | 277,558 | 285,685 | 297,506 | 301,966 |
Contents: Cities and Communes
The population development of the cities and communes in Rust (Stadt).
| Name | Status | District | Population Census 1981-05-12 | Population Census 1991-05-15 | Population Census 2001-05-15 | Population Census 2011-10-31 | Population Census 2021-10-31 | Population Estimate 2024-01-01 | |
|---|---|---|---|---|---|---|---|---|---|
| Rust | District-level City | Rust (Stadt) | 1,693 | 1,696 | 1,714 | 1,896 | 1,984 | 1,984 | → |
Source: Statistik Austria.
Explanation: 2024 population figures are preliminary estimates