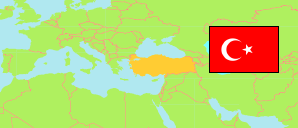
Yeşilova
District in Burdur
District
The population development of Yeşilova.
| Name | Status | Population Estimate 2009-12-31 | Population Estimate 2013-12-31 | Population Estimate 2017-12-31 | Population Estimate 2022-12-31 | |
|---|---|---|---|---|---|---|
| Yeşilova | District | 17,766 | 16,973 | 15,506 | 14,503 | → |
| Burdur | Province | 251,550 | 257,267 | 264,779 | 273,799 |
Contents: Cities, Towns and Villages
The population development of the cities, towns and villages in Yeşilova.
| Name | Status | District | Population Estimate 2009-12-31 | Population Estimate 2013-12-31 | Population Estimate 2017-12-31 | Population Estimate 2022-12-31 | |
|---|---|---|---|---|---|---|---|
| Güney | Village | Yeşilova | 1,845 | 1,458 | 1,190 | 1,033 | → |
| Salda | Village | Yeşilova | 1,364 | 1,263 | 1,104 | 1,073 | → |
| Yeşilova | City | Yeşilova | 4,724 | 5,726 | 5,495 | 5,408 | → |
Source: State Institute of Statistics, Republic of Türkiye.
Explanation: Since 2013, the population figures of cities in metropolitan provinces are calculated by using the population of selected neighborhoods.