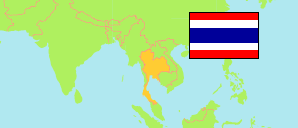
Phetchaburi
Province in Western Region
Province
The population development of Phetchaburi.
| Name | Native | Status | Population Estimate 2005-12-31 | Population Estimate 2010-12-31 | Population Estimate 2015-12-31 | Population Estimate 2019-12-31 | |
|---|---|---|---|---|---|---|---|
| Phetchaburi | จังหวัดเพชรบุรี | Province | 453,982 | 464,033 | 478,589 | 484,294 | → |
| Western | ภาคตะวันตก | Planning Region | 3,628,123 | 3,691,925 | 3,807,412 | 3,842,289 |
Contents: Municipalities
The population development of the municipalities in Phetchaburi.
| Name | Native | Status | Province | Population Estimate 2005-12-31 | Population Estimate 2010-12-31 | Population Estimate 2015-12-31 | Population Estimate 2019-12-31 | |
|---|---|---|---|---|---|---|---|---|
| Bang Tabun | บางตะบูน | Commune | Phetchaburi | 5,965 | 5,755 | 5,409 | 5,248 | → |
| Ban Laem | บ้านแหลม | Commune | Phetchaburi | 13,826 | 13,023 | 12,447 | 12,023 | → |
| Ban Lat | บ้านลาด | Commune | Phetchaburi | 3,637 | 3,716 | 3,695 | 3,709 | → |
| Cha-am | ชะอำ | Town | Phetchaburi | 30,102 | 32,895 | 36,332 | 39,286 | → |
| Hat Chao Samran | หาดเจ้าสำราญ | Commune | Phetchaburi | 4,518 | 4,724 | 4,880 | 4,942 | → |
| Hua Saphan | หัวสะพาน | Commune | Phetchaburi | 6,211 | 6,153 | 6,101 | 5,990 | → |
| Khao Yoi | เขาย้อย | Commune | Phetchaburi | 15,267 | 15,324 | 15,556 | 15,528 | → |
| Na Yang | นายาง | Commune | Phetchaburi | 17,920 | 18,612 | 19,099 | 19,404 | → |
| Nong Chok | หนองจอก | Commune | Phetchaburi | 2,698 | 2,772 | 2,765 | 2,732 | → |
| Phetchaburi | เพชรบุรี | Town | Phetchaburi | 26,181 | 24,422 | 22,935 | 21,647 | → |
| Tha Laeng | ท่าแลง | Commune | Phetchaburi | ... | 5,842 | 6,061 | 6,153 | → |
| Tha Yang | ท่ายาง | Commune | Phetchaburi | 28,429 | 28,395 | 28,480 | 28,445 | → |
Source: Department of Provincial Administration, Official Statistics Registration Systems (web).
Explanation: The registered population differs strongly from the results of the 2010 census.