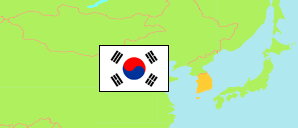
Jeollanam-do
Province in South Korea
Contents: Subdivision
The population development in Jeollanam-do as well as related information and services (Wikipedia, Google, images).
| Name | Status | Native | Population Census 1980-11-01 | Population Census 1990-11-01 | Population Census 2000-11-01 | Population Census 2010-11-01 | Population Census 2015-11-01 | Population Census 2020-11-01 | |
|---|---|---|---|---|---|---|---|---|---|
| Jeollanam-do [South Jeolla] | Province | 전라남도 | 2,923,191 | 2,507,439 | 1,996,456 | 1,741,499 | 1,799,044 | 1,788,807 | |
| Boseong-gun | County | 보성군 | 127,531 | 106,742 | 55,924 | 40,166 | 40,688 | 37,888 | → |
| Damyang-gun | County | 담양군 | 91,141 | 73,855 | 54,597 | 41,027 | 43,634 | 44,201 | → |
| Gangjin-gun | County | 강진군 | 91,811 | 70,592 | 44,055 | 34,204 | 35,126 | 32,778 | → |
| Goheung-gun | County | 고흥군 | 191,639 | 134,294 | 87,738 | 63,392 | 62,477 | 60,045 | → |
| Gokseong-gun | County | 곡성군 | 75,101 | 49,707 | 38,042 | 27,272 | 28,617 | 27,349 | → |
| Gurye-gun | County | 구례군 | 57,967 | 41,398 | 28,705 | 22,419 | 24,595 | 23,907 | → |
| Gwangyang-si | City | 광양시 | 78,635 | 150,291 | 132,639 | 137,810 | 144,414 | 143,928 | → |
| Haenam-gun | County | 해남군 | 168,689 | 134,279 | 89,603 | 66,042 | 69,237 | 65,223 | → |
| Hampyeong-gun | County | 함평군 | 96,358 | 63,091 | 41,292 | 30,995 | 31,367 | 30,156 | → |
| Hwasun-gun | County | 화순군 | 107,405 | 86,697 | 72,162 | 62,219 | 61,380 | 60,247 | → |
| Jangheung-gun | County | 장흥군 | 112,961 | 68,284 | 48,305 | 35,763 | 36,890 | 35,273 | → |
| Jangseong-gun | County | 장성군 | 94,869 | 61,838 | 49,703 | 38,507 | 42,058 | 41,443 | → |
| Jindo-gun | County | 진도군 | 83,424 | 54,609 | 38,459 | 28,565 | 29,538 | 29,297 | → |
| Mokpo-si | City | 목포시 | 221,814 | 243,064 | 250,480 | 249,960 | 239,524 | 224,509 | → |
| Muan-gun | County | 무안군 | 115,327 | 90,498 | 62,352 | 68,462 | 80,521 | 84,637 | → |
| Naju-si | City | 나주시 | 186,005 | 158,634 | 99,533 | 78,679 | 92,582 | 113,293 | → |
| Sinan-gun | County | 신안군 | 130,979 | 102,409 | 46,315 | 33,222 | 36,235 | 35,138 | → |
| Suncheon-si | City | 순천시 | 238,159 | 271,558 | 265,930 | 258,670 | 265,390 | 272,449 | → |
| Wando-gun | County | 완도군 | 126,762 | 85,751 | 61,517 | 46,777 | 48,468 | 48,269 | → |
| Yeongam-gun | County | 영암군 | 100,037 | 68,833 | 60,343 | 58,748 | 61,535 | 57,076 | → |
| Yeonggwang-gun | County | 영광군 | 119,600 | 85,483 | 65,529 | 48,663 | 51,007 | 50,196 | → |
| Yeosu-si | City | 여수시 | 306,977 | 305,532 | 303,233 | 269,937 | 273,761 | 271,505 | → |
| Daehan Minguk [South Korea] | Republic | 대한민국 | 37,436,315 | 43,410,899 | 46,136,101 | 48,580,293 | 51,069,375 | 51,829,136 |
Source: National Statistical Office of the Republic of Korea (web).
Explanation: Since 2015, a register-based census is performed. Nevertheless, the results are not consistent with the population figures from the resident registration that are higher by about 3.5% on average.
Further information about the population structure:
| Gender (C 2020) | |
|---|---|
| Males | 903,281 |
| Females | 885,526 |
| Age Groups (C 2020) | |
|---|---|
| 0-14 years | 208,760 |
| 15-64 years | 1,166,195 |
| 65+ years | 413,852 |
| Age Distribution (C 2020) | |
|---|---|
| 90+ years | 14,883 |
| 80-89 years | 103,290 |
| 70-79 years | 184,866 |
| 60-69 years | 257,648 |
| 50-59 years | 298,881 |
| 40-49 years | 252,465 |
| 30-39 years | 191,379 |
| 20-29 years | 194,394 |
| 10-19 years | 159,118 |
| 0-9 years | 131,883 |
| Citizenship (C 2020) | |
|---|---|
| Korea | 1,743,571 |
| Foreign Citizenship | 45,236 |