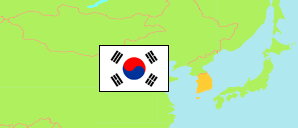
Chungcheongnam-do
Province in South Korea
Contents: Subdivision
The population development in Chungcheongnam-do as well as related information and services (Wikipedia, Google, images).
| Name | Status | Native | Population Census 1980-11-01 | Population Census 1990-11-01 | Population Census 2000-11-01 | Population Census 2010-11-01 | Population Census 2015-11-01 | Population Census 2020-11-01 | |
|---|---|---|---|---|---|---|---|---|---|
| Chungcheongnam-do [South Chungcheong] | Province | 충청남도 | 2,152,260 | 2,013,926 | 1,765,290 | 1,946,555 | 2,107,802 | 2,176,636 | |
| Asan-si | City | 아산시 | 157,979 | 164,989 | 180,763 | 278,676 | 319,929 | 340,518 | → |
| Boryeong-si | City | 보령시 | 151,243 | 146,008 | 109,535 | 97,770 | 101,852 | 99,088 | → |
| Buyeo-gun | County | 부여군 | 153,769 | 116,908 | 83,687 | 67,584 | 69,017 | 64,207 | → |
| Cheonan-si | City | 천안시 | 231,018 | 313,737 | 417,835 | 574,623 | 629,062 | 682,199 | → |
| Cheongyang-gun | County | 청양군 | 72,697 | 53,750 | 38,601 | 29,755 | 31,653 | 30,103 | → |
| Dangjin-si | City | 당진시 | 150,825 | 131,763 | 117,652 | 137,006 | 163,762 | 168,955 | → |
| Geumsan-gun | County | 금산군 | 103,989 | 84,064 | 57,929 | 52,952 | 55,923 | 53,758 | → |
| Gongju-si | City | 공주시 | 167,379 | 158,067 | 130,376 | 122,153 | 113,542 | 108,333 | → |
| Gyeryong-si | City | 계룡시 | 10,592 | 11,684 | 27,122 | 41,528 | 39,243 | 40,854 | → |
| Hongseong-gun | County | 홍성군 | 132,194 | 105,399 | 90,658 | 82,811 | 94,114 | 102,757 | → |
| Nonsan-si | City | 논산시 | 196,700 | 175,752 | 137,452 | 119,222 | 124,246 | 119,707 | → |
| Seocheon-gun | County | 서천군 | 129,512 | 100,545 | 66,929 | 53,914 | 54,768 | 51,039 | → |
| Seosan-si | City | 서산시 | 150,623 | 148,538 | 143,154 | 156,843 | 169,221 | 176,379 | → |
| Taean-gun | County | 태안군 | 98,658 | 83,493 | 65,928 | 53,888 | 59,723 | 60,901 | → |
| Yesan-gun | County | 예산군 | 147,725 | 128,727 | 97,669 | 77,830 | 81,747 | 77,838 | → |
| Daehan Minguk [South Korea] | Republic | 대한민국 | 37,436,315 | 43,410,899 | 46,136,101 | 48,580,293 | 51,069,375 | 51,829,136 |
Source: National Statistical Office of the Republic of Korea (web).
Explanation: Since 2015, a register-based census is performed. Nevertheless, the results are not consistent with the population figures from the resident registration that are higher by about 3.5% on average.
Further information about the population structure:
| Gender (C 2020) | |
|---|---|
| Males | 1,117,575 |
| Females | 1,059,061 |
| Age Groups (C 2020) | |
|---|---|
| 0-14 years | 274,828 |
| 15-64 years | 1,506,660 |
| 65+ years | 395,148 |
| Age Distribution (C 2020) | |
|---|---|
| 90+ years | 13,860 |
| 80-89 years | 97,668 |
| 70-79 years | 168,132 |
| 60-69 years | 273,292 |
| 50-59 years | 340,909 |
| 40-49 years | 333,868 |
| 30-39 years | 292,788 |
| 20-29 years | 274,260 |
| 10-19 years | 206,847 |
| 0-9 years | 175,012 |
| Citizenship (C 2020) | |
|---|---|
| Korea | 2,077,470 |
| Foreign Citizenship | 99,166 |