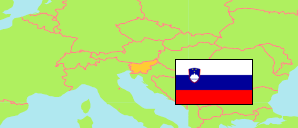
Gornji Grad
Municipality in Savinjska
Municipality
The population development of Gornji Grad.
| Name | Status | Population Census 2002-03-31 | Population Census 2011-01-01 | Population Census 2021-01-01 | Population Estimate 2022-01-01 | |
|---|---|---|---|---|---|---|
| Gornji Grad | Municipality | 2,595 | 2,665 | 2,480 | 2,552 | → |
| Savinjska [Savinja] | Region | 253,574 | 259,726 | 264,428 | 264,206 |
Contents: Settlements
The population development of the settlements in Gornji Grad.
| Name | Status | Municipality | Population Census 2002-03-31 | Population Census 2011-01-01 | Population Census 2021-01-01 | Population Estimate 2022-01-01 | |
|---|---|---|---|---|---|---|---|
| Bočna | Settlement | Gornji Grad | 662 | 621 | 588 | 595 | → |
| Florjan pri Gornjem Gradu | Settlement | Gornji Grad | 189 | 185 | 164 | 163 | → |
| Gornji Grad | Settlement | Gornji Grad | 922 | 1,048 | 1,013 | 1,072 | → |
| Lenart pri Gornjem Gradu | Settlement | Gornji Grad | 142 | 147 | 115 | 114 | → |
| Nova Štifta | Settlement | Gornji Grad | ... | 633 | 577 | 580 | → |
Source: Statistical Office of the Republic of Slovenia (web).
Explanation: The 2011 and 2021 population figures are result of a register-based census.