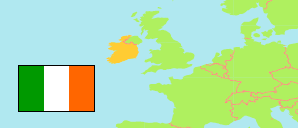
Connacht
Province in Ireland
Contents: Subdivision
The population development in Connacht as well as related information and services (Wikipedia, Google, images).
| Name | Status | Population Census 1981-04-05 | Population Census 1986-04-13 | Population Census 1991-04-21 | Population Census 1996-04-28 | Population Census 2002-04-28 | Population Census 2006-04-23 | Population Census 2011-04-10 | Population Census 2016-04-24 | Population Census 2022-04-03 | |
|---|---|---|---|---|---|---|---|---|---|---|---|
| Connacht | Province | 424,410 | 431,409 | 423,031 | 433,231 | 464,296 | 504,121 | 542,547 | 550,688 | 591,363 | |
| Galway | County | ... | 131,448 | 129,511 | 131,613 | 143,245 | 159,256 | 175,124 | 179,390 | 193,323 | → |
| Galway City | City | ... | 47,104 | 50,853 | 57,241 | 65,832 | 72,414 | 75,529 | 78,668 | 84,414 | → |
| Leitrim | County | 27,609 | 27,035 | 25,301 | 25,057 | 25,799 | 28,950 | 31,798 | 32,044 | 35,199 | → |
| Mayo | County | 114,766 | 115,184 | 110,713 | 111,524 | 117,446 | 123,839 | 130,638 | 130,507 | 137,970 | → |
| Roscommon | County | 54,543 | 54,592 | 51,897 | 51,975 | 53,774 | 58,768 | 64,065 | 64,544 | 70,259 | → |
| Sligo | County | 55,474 | 56,046 | 54,756 | 55,821 | 58,200 | 60,894 | 65,393 | 65,535 | 70,198 | → |
| Ireland (Éire) | Republic | 3,443,405 | 3,540,643 | 3,525,719 | 3,626,087 | 3,917,203 | 4,239,848 | 4,588,252 | 4,761,865 | 5,149,139 |
Source: Central Statistics Office, Ireland.
Further information about the population structure:
| Gender (C 2022) | |
|---|---|
| Males | 292,578 |
| Females | 298,785 |
| Age Groups (C 2022) | |
|---|---|
| 0-17 years | 138,565 |
| 18-64 years | 350,067 |
| 65+ years | 102,731 |
| Age Distribution (C 2022) | |
|---|---|
| 90+ years | 4,009 |
| 80-89 years | 20,325 |
| 70-79 years | 46,802 |
| 60-69 years | 66,091 |
| 50-59 years | 76,416 |
| 40-49 years | 87,390 |
| 30-39 years | 74,214 |
| 20-29 years | 62,566 |
| 10-19 years | 80,856 |
| 0-9 years | 72,694 |
| Country of Birth (C 2022) | |
|---|---|
| Ireland | 475,064 |
| Other country | 116,299 |
| Religion (C 2022) | |
|---|---|
| Catholic | 442,722 |
| Other Religion | 42,501 |
| No Religion | 72,051 |