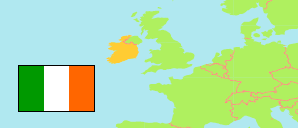
Mayo
County in Ireland
Contents: Population
The population development of Mayo as well as related information and services (Wikipedia, Google, images).
| Name | Status | Population Census 1981-04-05 | Population Census 1986-04-13 | Population Census 1991-04-21 | Population Census 1996-04-28 | Population Census 2002-04-28 | Population Census 2006-04-23 | Population Census 2011-04-10 | Population Census 2016-04-24 | Population Census 2022-04-03 | |
|---|---|---|---|---|---|---|---|---|---|---|---|
| Mayo | County | 114,766 | 115,184 | 110,713 | 111,524 | 117,446 | 123,839 | 130,638 | 130,507 | 137,970 | |
| Ireland (Éire) | Republic | 3,443,405 | 3,540,643 | 3,525,719 | 3,626,087 | 3,917,203 | 4,239,848 | 4,588,252 | 4,761,865 | 5,149,139 |
Source: Central Statistics Office, Ireland.
Further information about the population structure:
| Gender (C 2022) | |
|---|---|
| Males | 68,392 |
| Females | 69,578 |
| Age Groups (C 2022) | |
|---|---|
| 0-17 years | 31,911 |
| 18-64 years | 78,731 |
| 65+ years | 27,328 |
| Age Distribution (C 2022) | |
|---|---|
| 90+ years | 1,052 |
| 80-89 years | 5,373 |
| 70-79 years | 12,602 |
| 60-69 years | 17,203 |
| 50-59 years | 18,567 |
| 40-49 years | 19,428 |
| 30-39 years | 16,583 |
| 20-29 years | 12,084 |
| 10-19 years | 18,364 |
| 0-9 years | 16,714 |
| Country of Birth (C 2022) | |
|---|---|
| Ireland | 111,121 |
| Other country | 26,849 |
| Religion (C 2022) | |
|---|---|
| Catholic | 109,833 |
| Other Religion | 8,601 |
| No Religion | 13,449 |